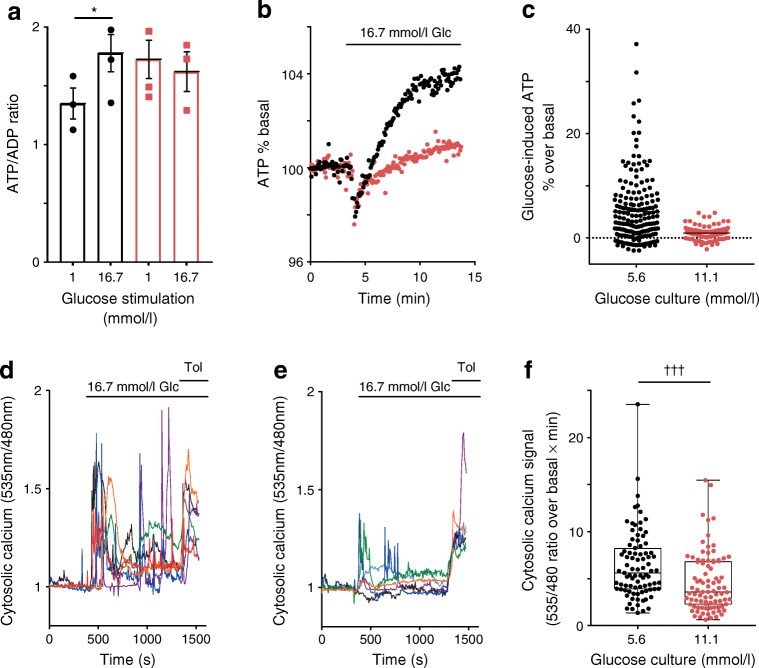
Fig. 4.
Elevated basal ATP/ADP ratio and blunted ATP and Ca2+ responses to glucose in islet cells after culture under conditions of chronic elevated glucose. (a) Extracts from islet clusters were analysed by LC–MS and the ATP/ADP ratios were calculated from ATP and ADP signals. Islet clusters were cultured in 5.6 mmol/l glucose (black bars) or 11.1 mmol/l glucose (red bars) and equilibrated in KRBH containing 1 mmol/l glucose, followed by 15 min incubation in the presence of either 1 mmol/l glucose or 16.7 mmol/l glucose, as indicated. The mean ATP/ADP ratio ± SEM in samples from three islet donors is shown. LMM, *p < 0.05. (b) Human islet clusters were infected with Ad-CMV-cytoAteam 1 day prior to the experiment. Cells were equilibrated in basal conditions (1 mmol/l glucose) and stimulated with glucose (Glc; 16.7 mmol/l), as indicated. Relative cytosolic ATP signals were monitored over time. Mean ATP responses to glucose of cells from three donors cultured in 5.6 mmol/l (black circles) or 11.1 mmol/l (red circles) are shown and expressed as percentage of the signal ratio under basal conditions. (c) Quantification of the Ateam responses in individual cells 10 min after initiation of glucose stimulation of islet clusters grown in control conditions (5.6 mmol/l glucose; 185 cells) or under chronic elevated glucose (11.1 mmol/l; 161 cells) conditions. (d–f) Human islet cells were infected with Ad-RIP-YC3.6 for beta cell-specific cytosolic Ca2+ measurements. After 35 min in KRBH containing 1 mmol/l glucose, the cells were stimulated with glucose (16.7 mmol/l) and, 15 min later, with tolbutamide (Tol; 100 μmol/l), as shown. Cytosolic Ca2+ rose after 5.6 mmol/l glucose culture (control) (d) and 11.1 mmol/l glucose culture (e). Different colours were used for the individual cells responding to glucose. (f) Quantification of cytosolic Ca2+ signals of individual cells from three donors corresponding to the conditions shown in (d) (5.6 mmol/l glucose; 86 cells) and (e) (11.1 mmol/l; 81 cells). The AUC was determined as the increase of the YC3.6 emission ratio (535 nm/480 nm) over basal during the first 3 min after glucose stimulation. Analysis of each cell is shown as a single data point. Mean plus minus quartiles are also indicated. LMM, †††p < 0.001

