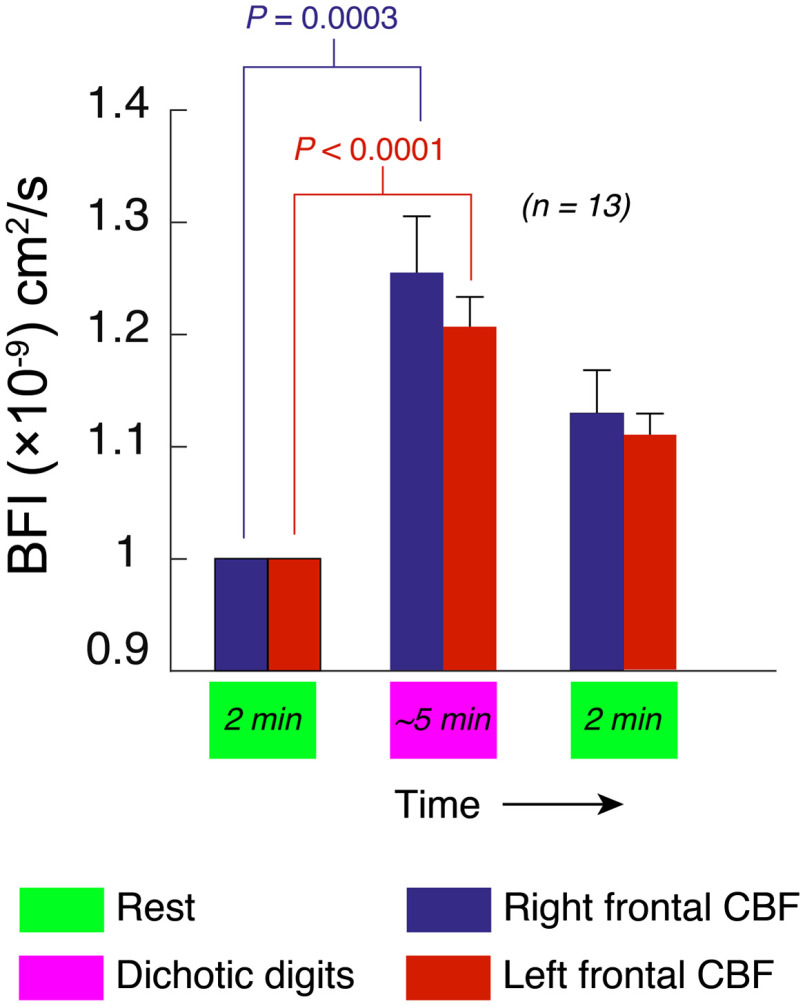
Fig. 4.
CBF activation during a diotic listening task, averaged over all subjects. Blue and red bars depict relative changes in, respectively, right and left hemispheres. The values are normalized to the first rest period. Error bars represent standard error of the mean, -values (two-tailed Student’s -test) are shown and “N.S.” indicates .

