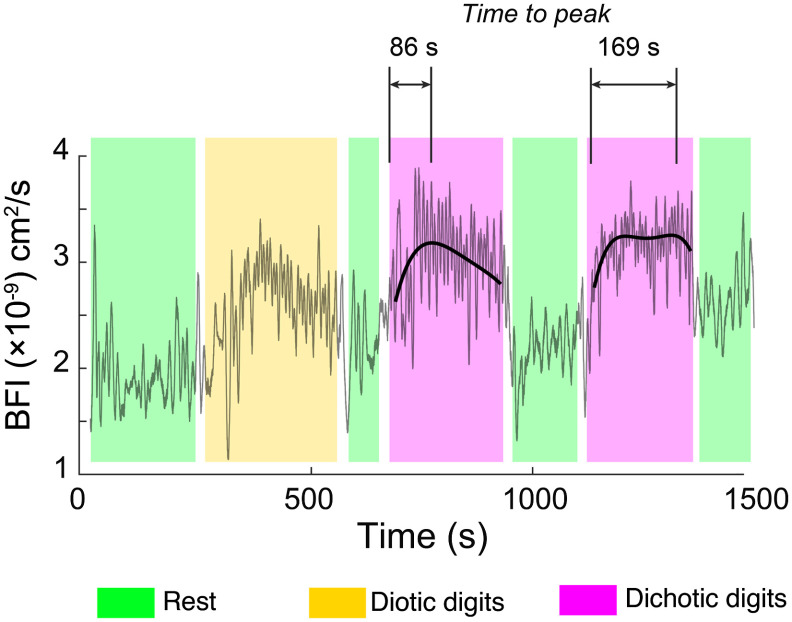
Fig. 6.
Activation kinetics in the right prefrontal cortex differs between the two dichotic listening blocks. Here, local third-order polynomial fits are superimposed over the raw optical data during the dichotic listening periods. The shaded regions indicate rest (light green), diotic (light yellow), and dichotic (light purple) blocks. The increased time-to-peak in diotic block 2 that is highlighted here is representative of the population average. No statistically significant corresponding change in kinetics was found in the left hemisphere.

