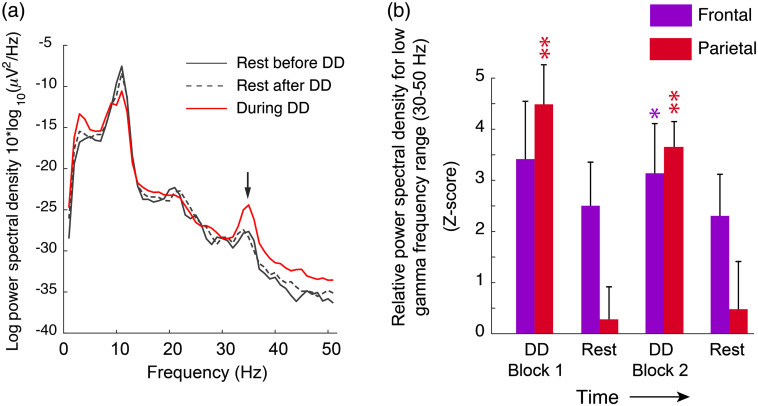
Fig. 7.
Dichotic listening increases EEG low gamma power in frontal and parietal recording locations. (a) EEG spectrum in a representative subject during dichotic listening periods (red trace) as well as rest periods before and after (solid and dotted black traces, respectively). The trace is averaged over parietal EEG recording locations. (b) Bar chart summarizing low-frequency gamma spectral power at frontal (purple) and parietal (red) recording locations during rest and dichotic digits (DD) listening periods. Because the baseline EEG power measurements varied between subjects, results are expressed as -score, which represents the ratio of averaged spectral power during the measurement period (i.e., rest or task) to the standard deviation of preblock fluctuations. Values with were considered significant. Asterisks indicate statistical significance as: * = , ** = .

