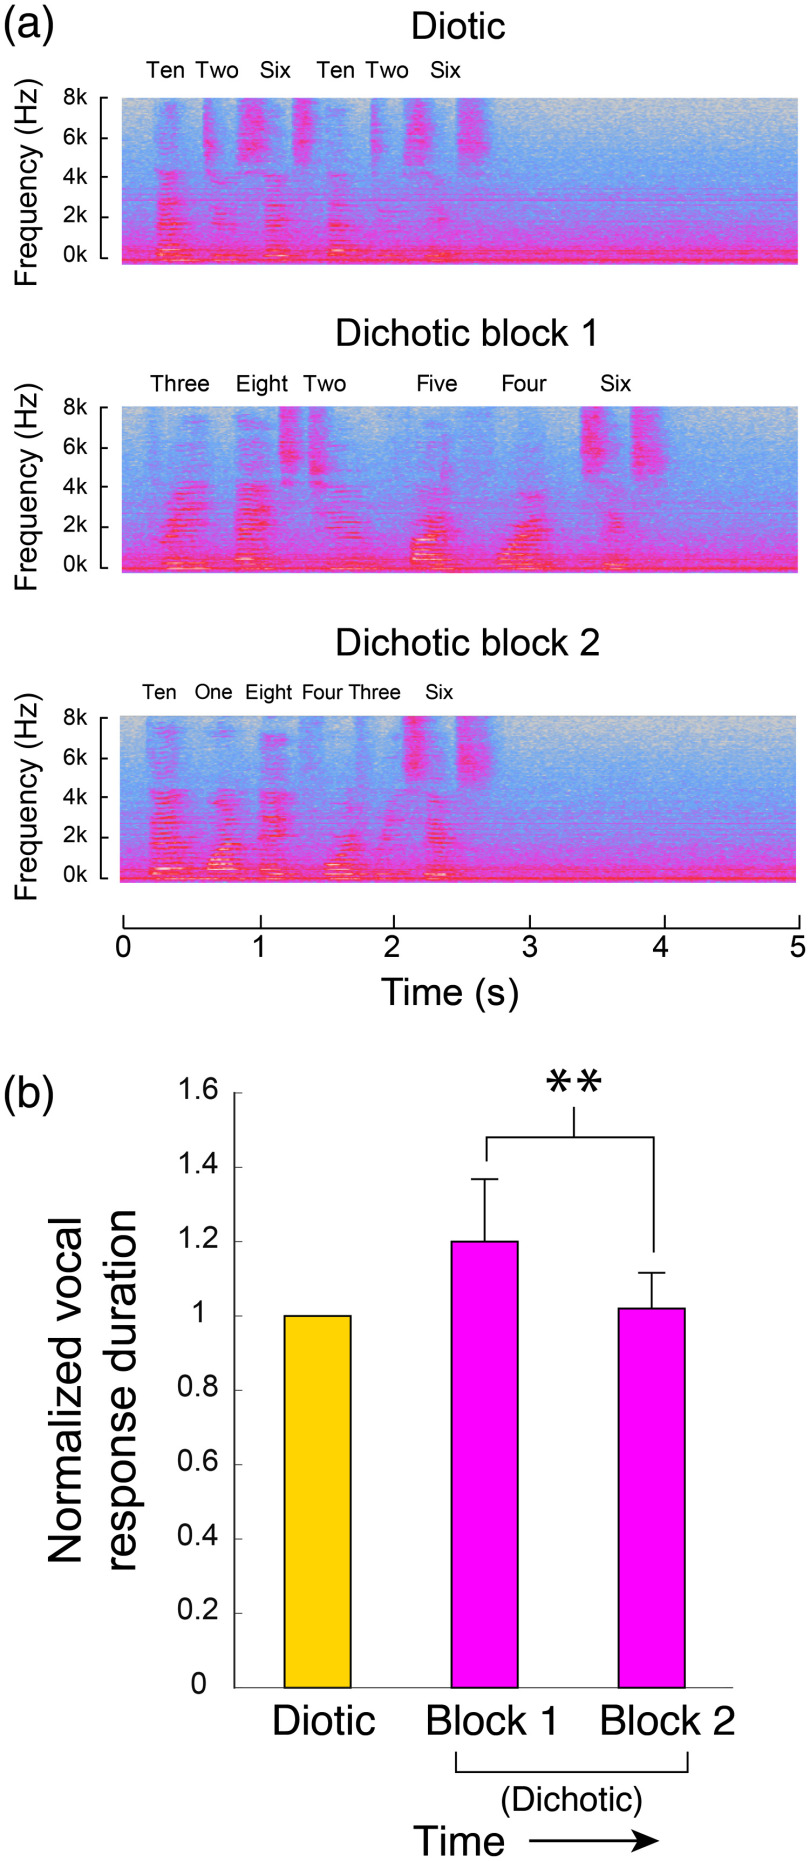
Fig. 8.
Analysis of verbal responses to listening tasks. (a) Short segments of the spectrogram of a representative subject’s verbal responses. The panels illustrate how speaking rhythm can be visualized in the time-frequency plots. The prolonged verbal response duration was most prominent in the first dichotic listening block. (b) The average total duration of the free-recall responses following auditory stimuli. Vocal response duration was defined based on the first and last time points where the total recorded audio amplitude exceeded the maximum ambient noise level in the room that was present during that test. Shown here are the average durations of a vocal response for diotic and dichotic task blocks, all normalized to the diotic response durations. The reduction in response duration visible when comparing dichotic block 1 to block 2 was significant ().

