
Figure 2. Validation of transcript stabilization in DCP2 KO cells.
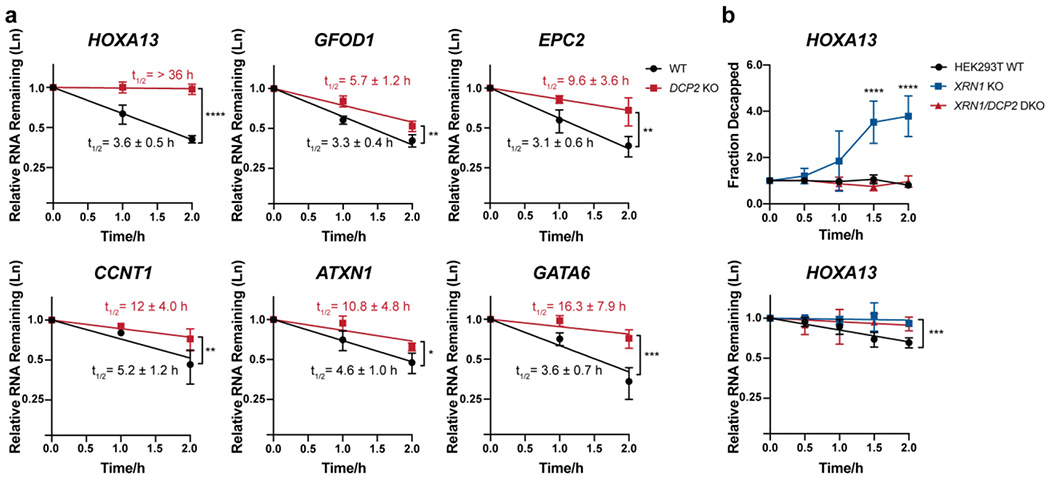
(a) The stabilities of selected Dcp2 targets were measured using qRT-PCR in DCP2 KO versus WT HEK293T cells treated with actinomycin D for the indicated times. Half-lives (95% CI) were obtained from linear regression analysis, and significance was determined using two-tailed t-test of the slope of regression lines. Error bars represent mean ± s.d. n=4 biological replicates for HOXA13, GATA6 and CCNT1 and n=3 biological replicates for all other genes. (b) Splinted ligation RT-PCR (qSL-RT-PCR) 45 in WT, XRN1 KO and XRN1/DCP2 double knockout (DKO) HEK293T cell lines was performed to assay decapping of selected Dcp2 targets. Significance was analyzed by ANOVA linear regression (total RNA) or at individual time points (splint ligation). Error bars represent mean ± s.d. n=4 biological replicates. P-values are denoted by asterisks; *P < 0.05; **P < 0.01; ***P < 0.001; ****P < 0.0001.