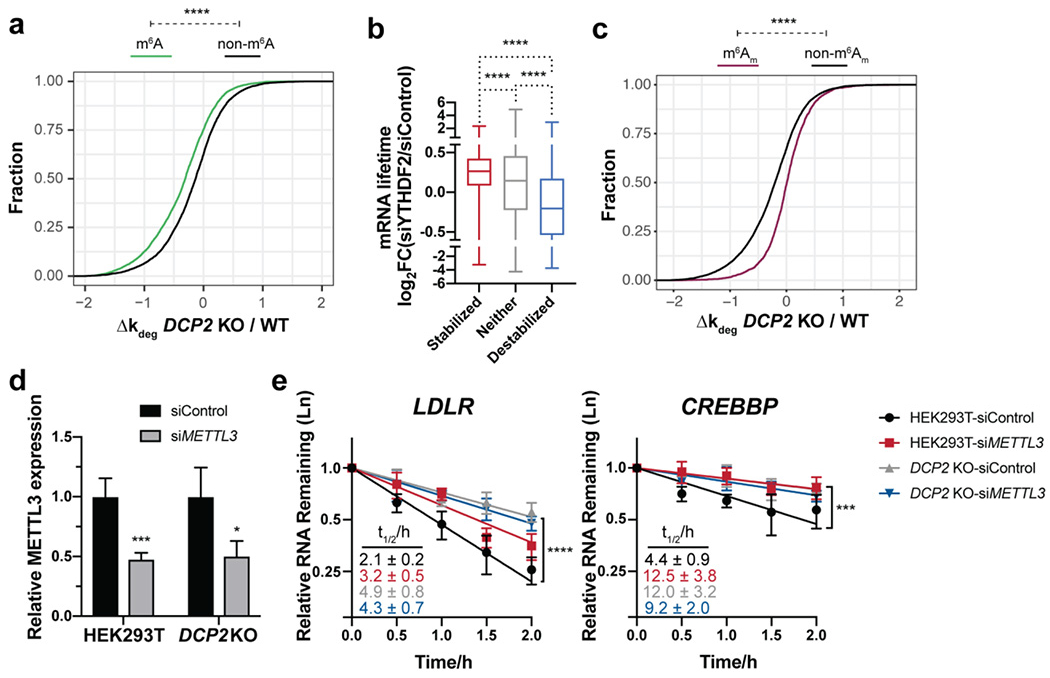
Figure 4.

m6A modifications are present in many Dcp2 targets and required for their decay, but are not sufficient to define Dcp2 substrates globally. (a) Cumulative distribution function (CDF) plots of the relative changes in decay rate of transcripts among m6A-containing (data from Jaffrey and co-workers, 2012) and non-target RNAs in DCP2 KO vs. WT. P-values were calculated using two-sided Mann-Whitney test; ****P < 0.0001. (b) Boxplots depicting RNA half-life changes after YTHDF2 silencing in HeLa cells (data from Wang et al., 2014) for each of the three classes of RNA stability changes in DCP2 KO cells. Statistical significance is derived from Mann-Whitney U test; ****P < 0.0001. (c) CDF plots of the relative changes in decay rate of transcripts among m6Am-containing (data from Mauer et al., 2016) and non-target RNAs in DCP2 KO vs. WT. P-values were calculated using two-sided Mann-Whitney test; ****P < 0.0001. (d) Silencing of METTL3 mRNA expression determined by qRT-PCR with reference to β-actin in WT or DCP2 KO HEK293T cells treated with non-targeting siRNA (siControl) or siMETTL3. (e) Relative RNA decay rates of two m6A-containing YTHDF2 targets were quantified by qRT-PCR after transcriptional inhibition in DCP2 KO or WT HEK293T cells transfected with either siMETTL3 or siControl. Error bars shown are mean ± s.d., n=4 biological replicates. P-values are calculated from ANOVA linear regression; ***P < 0.001; ****P < 0.0001.
