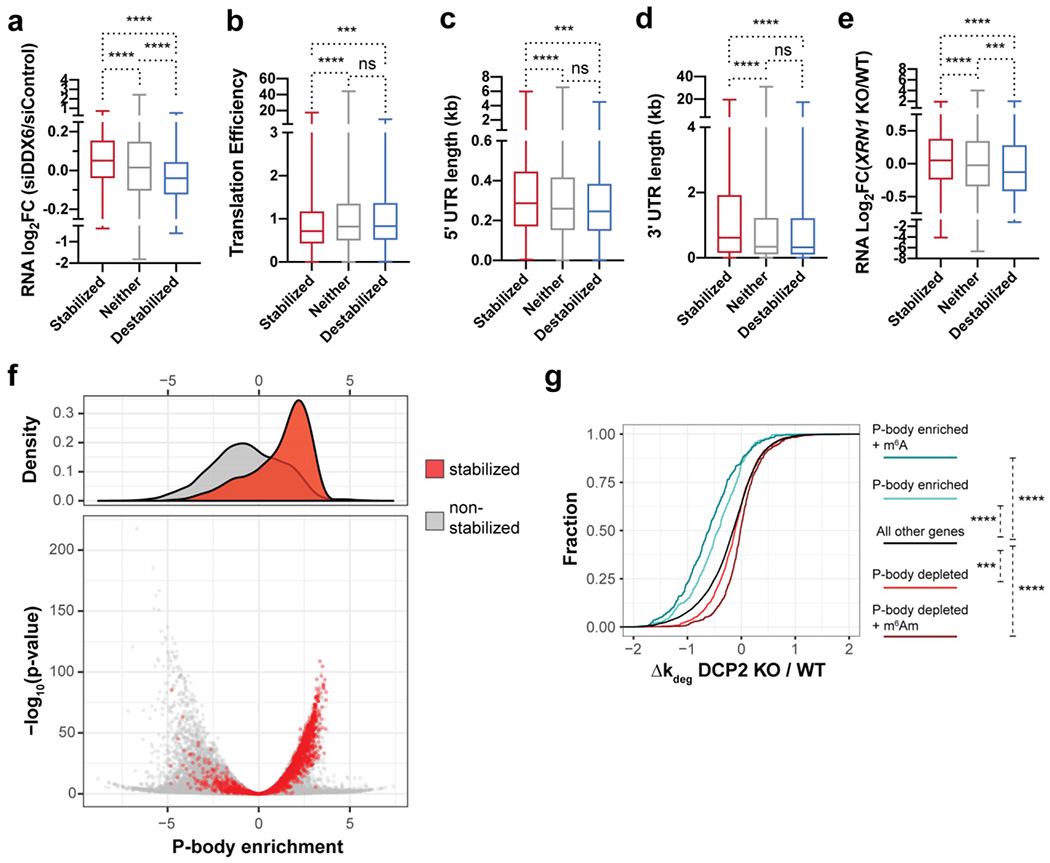
Figure 5.

Dcp2 targeting of RNAs correlates with P-body enrichment and is enhanced by m6A modification. (a-e) Boxplots quantifying differential expression of RNAs after DDX6 silencing in HEK293T cells relative to control (data from Courel et al., 2019) (a), translation efficiency (data from Sidrauski et al., 2015) (b), 5′ UTR length (c), 3′ UTR length (reference datasets from Khong et al., 2017) (d), and RNA enrichment after XRN1 knockout in HEK293T cells (data from Chang et al., 2019) (e) for each of the three classes of mRNA stability changes in DCP2 KO versus WT HEK293T cells. Statistical significance is calculated using Mann-Whitney U test. Ns, not significant (p>0.05); ***P<0.001; ****P < 0.0001. (f) P-body-enriched and -depleted RNAs were defined based on data from Hubstenberger et al., 2017 ((log2(fold change RNA enrichment in sorted P-body/pre-sorted fraction)>2.5 and <−2.5, respectively). In the density volcano plot of P-body association status, the red and grey spots represent transcripts stabilized in DCP2 KO cells and all other genes, respectively. (g) CDF plots of the relative changes in decay rate of transcripts among significantly P-body-enriched (defined as in c), P-body depleted, P-body enriched and m6A-containing (m6A data from Jaffrey and co-workers, 2012), P-body depleted and m6Am-containing (m6Am data from Mauer et al., 2017), and non-target RNAs in DCP2 KO relative to WT. P-values were calculated using two-sided Kruskal-Wallis test; ***P<0.001; ****P < 0.0001.
