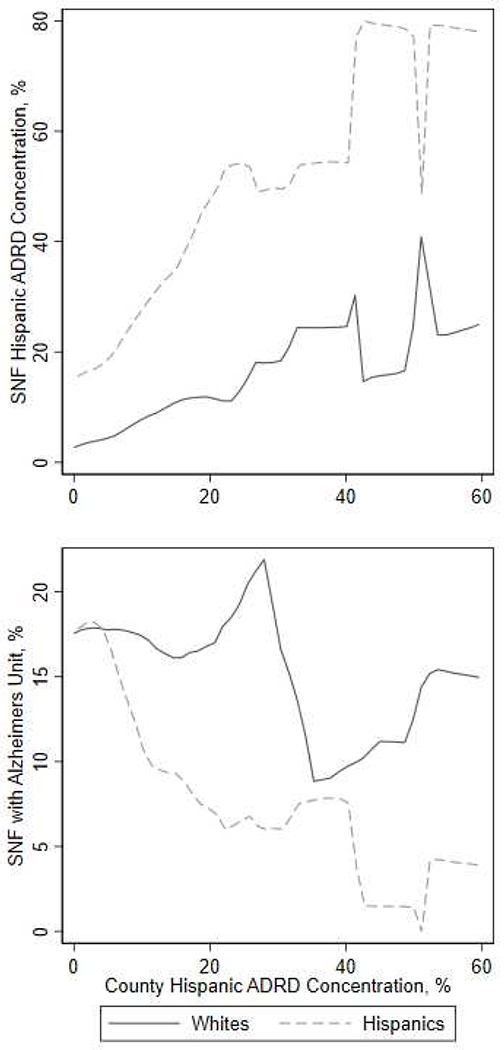
FIGURE A1: SKILLED NURSING FACILITY CONCENTRATION AND CHARACTERISTICS BY COUNTY HISPANIC ADRD CONCENTRATION.

The x axis in all the three panels displays the percentage of skilled nursing facility (SNF) admissions from a given county that were for a Hispanic patient with ADRD. The top panel shows for Hispanic and patients with ADRD, the average Hispanic ADRD concentration of the SNF by the county Hispanic ADRD concentration. The bottom panel shows the proportion of SNFs with Alzheimer’s special care unit y the county Hispanic ADRD concentration.
