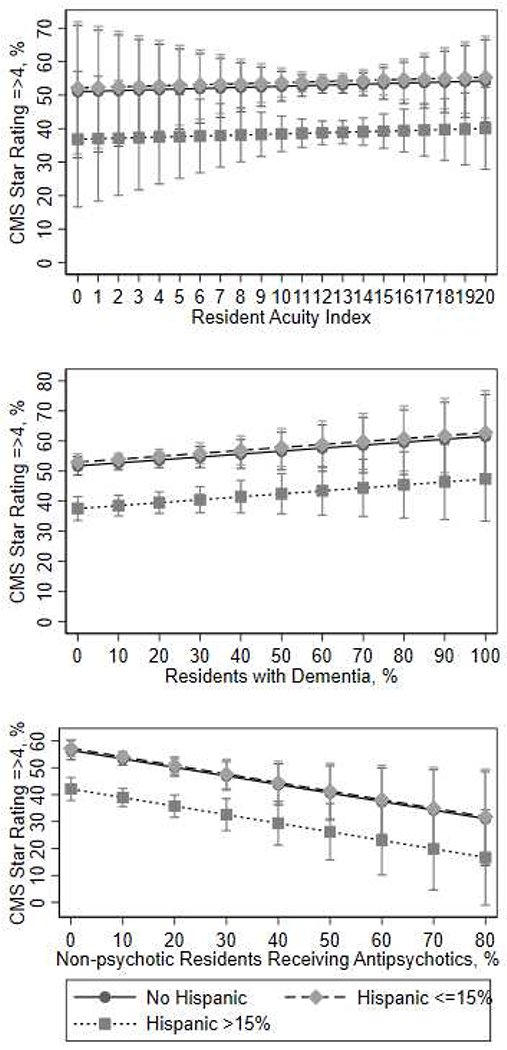
FIGURE A3: OVERALL SKILLED NURSING FACILITY QUALITY RATING BY RESIDENT CHARACTERISTICS.

In each panel, the Y axis displays the proportion of skilled nursing facilities with ratings greater or equal than four stars. The top pane shows the proportion of high-quality facilities among facilities with different concentration of Hispanics with ADRD, arrayed by the average resident acuity index. The middle panel shows the proportion of high-quality facilities by the proportion of residents with dementia. The bottom panel shows the proportion of high-quality facilities by the proportion of residents receiving antipsychotics.
