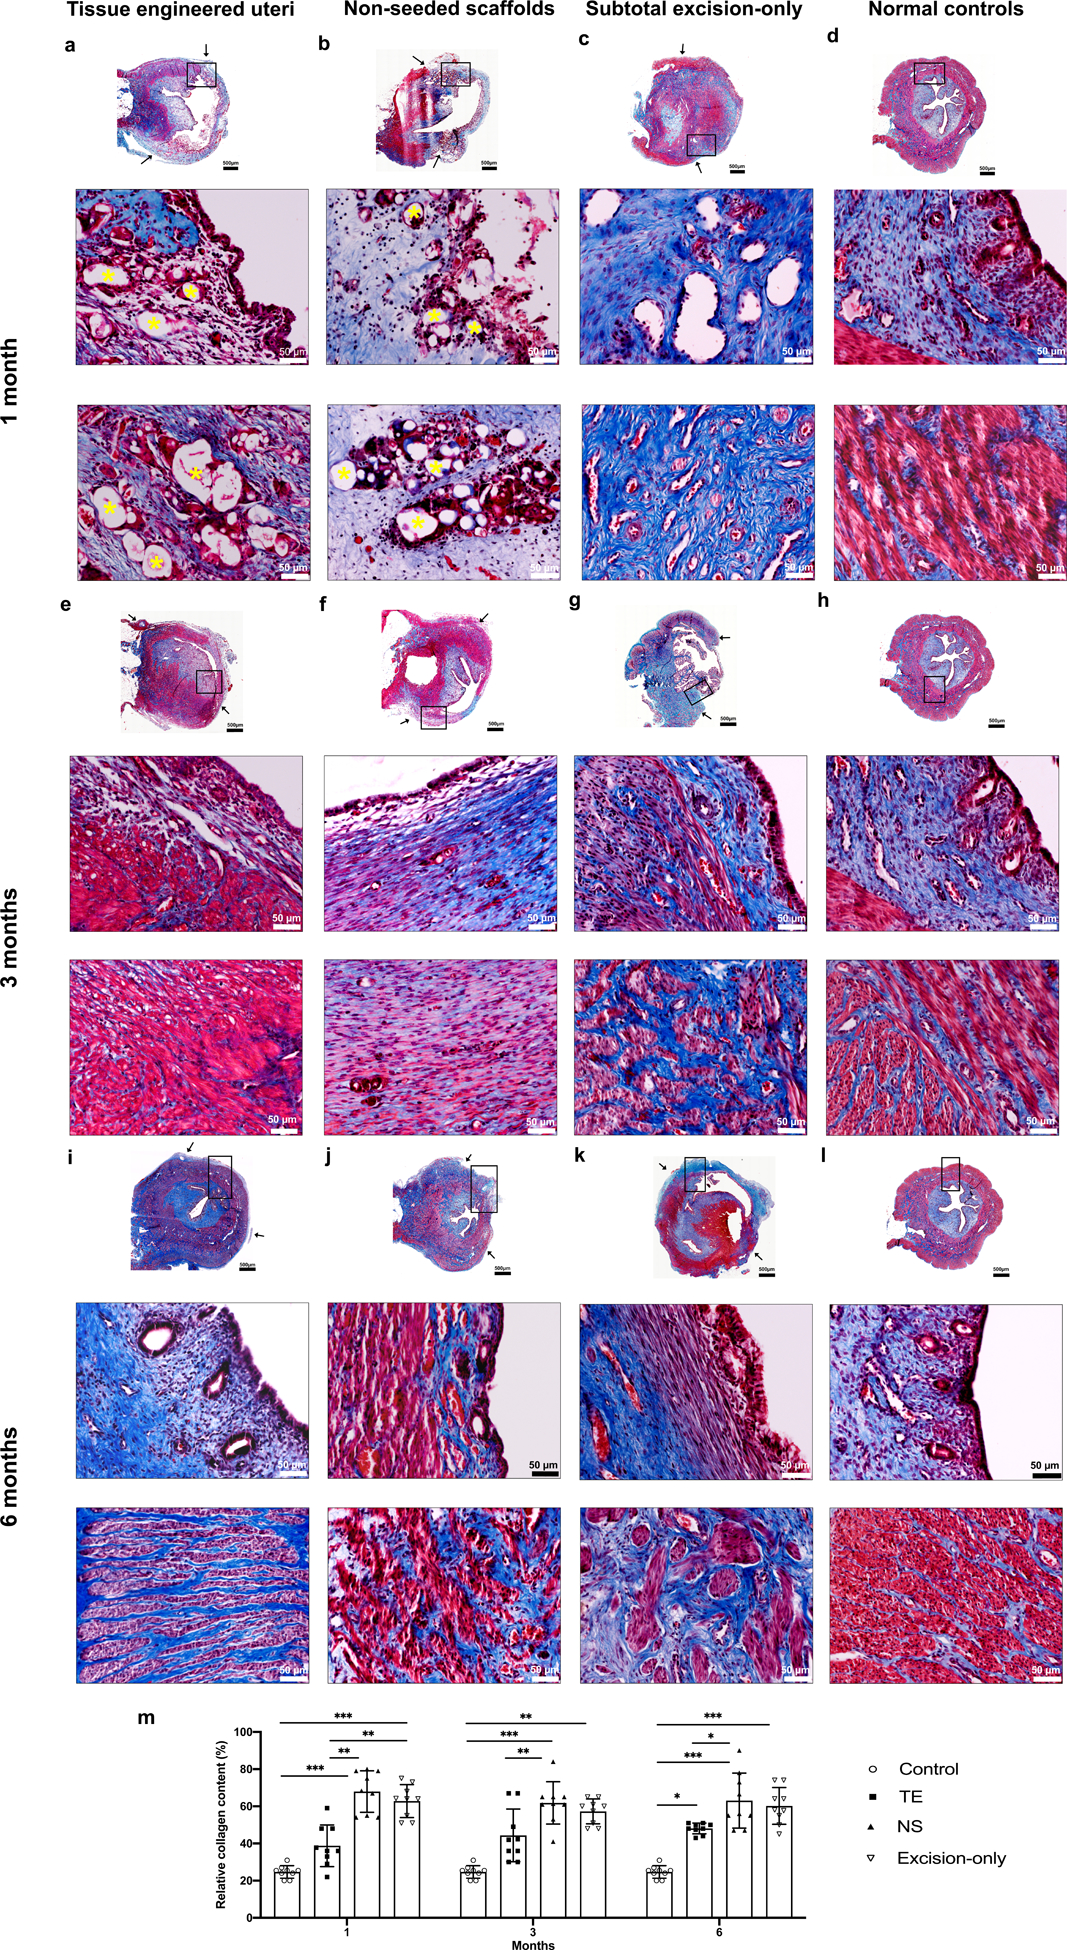
Figure 2.

Histological analysis of Masson’s trichrome (MT) stained cross-sections of reconstructed uterine segments retrieved at 1 (a - d) 3 (e - h), and 6 (i - l) months post-surgery. (a-b) At one-month post-implantation, partially degraded polymer material (yellow asterisk) was observed in the endometrium (a middle, b middle) and myometrium (a middle- b bottom) regions in the tissue engineered uteri and non-seeded scaffold groups. The subtotal excision-only group showed abundant granulomatous tissue accompanied by luminal strictures (c middle and bottom). (e, f) At three months, the polymer material was completely resorbed. Distinct lining endometrium (e middle) and myometrium structure (e bottom) developed in the tissue engineered uteri group, whereas the non-seeded group had sparse tissue ingrowth (f middle –f bottom), and the subtotal excision-only group had marked defects in the uterine wall (g). (i - l) Six months after surgery, the engineered seeded constructs showed organized tissue structures with native-like endometrium (I middle) and myometrium layers (I bottom), while the non-seeded scaffolds formed a thin uterine wall (j), and the subtotal excision-only controls showed scar formation (k). (m) Statistical analysis of the relative collagen content in MT stained slides (under a magnification of 100×) demonstrated that the non-seeded scaffold group formed the most collagen tissue overall. MT staining: blue, collagen/connective tissue; red, smooth muscle. Black arrows indicate the interface between the native uterine tissue and surgical area. Data shown are representative images from n=3 animals per time point in each group; experiments were repeated independently three times with similar results. One-tailed one-way ANOVA was performed followed by the Tukey test. Error bars, mean ± SD. * P < 0.05, ** P < 0.01, *** P < 0.001. Scale bars 500 μm; 50 μm.
