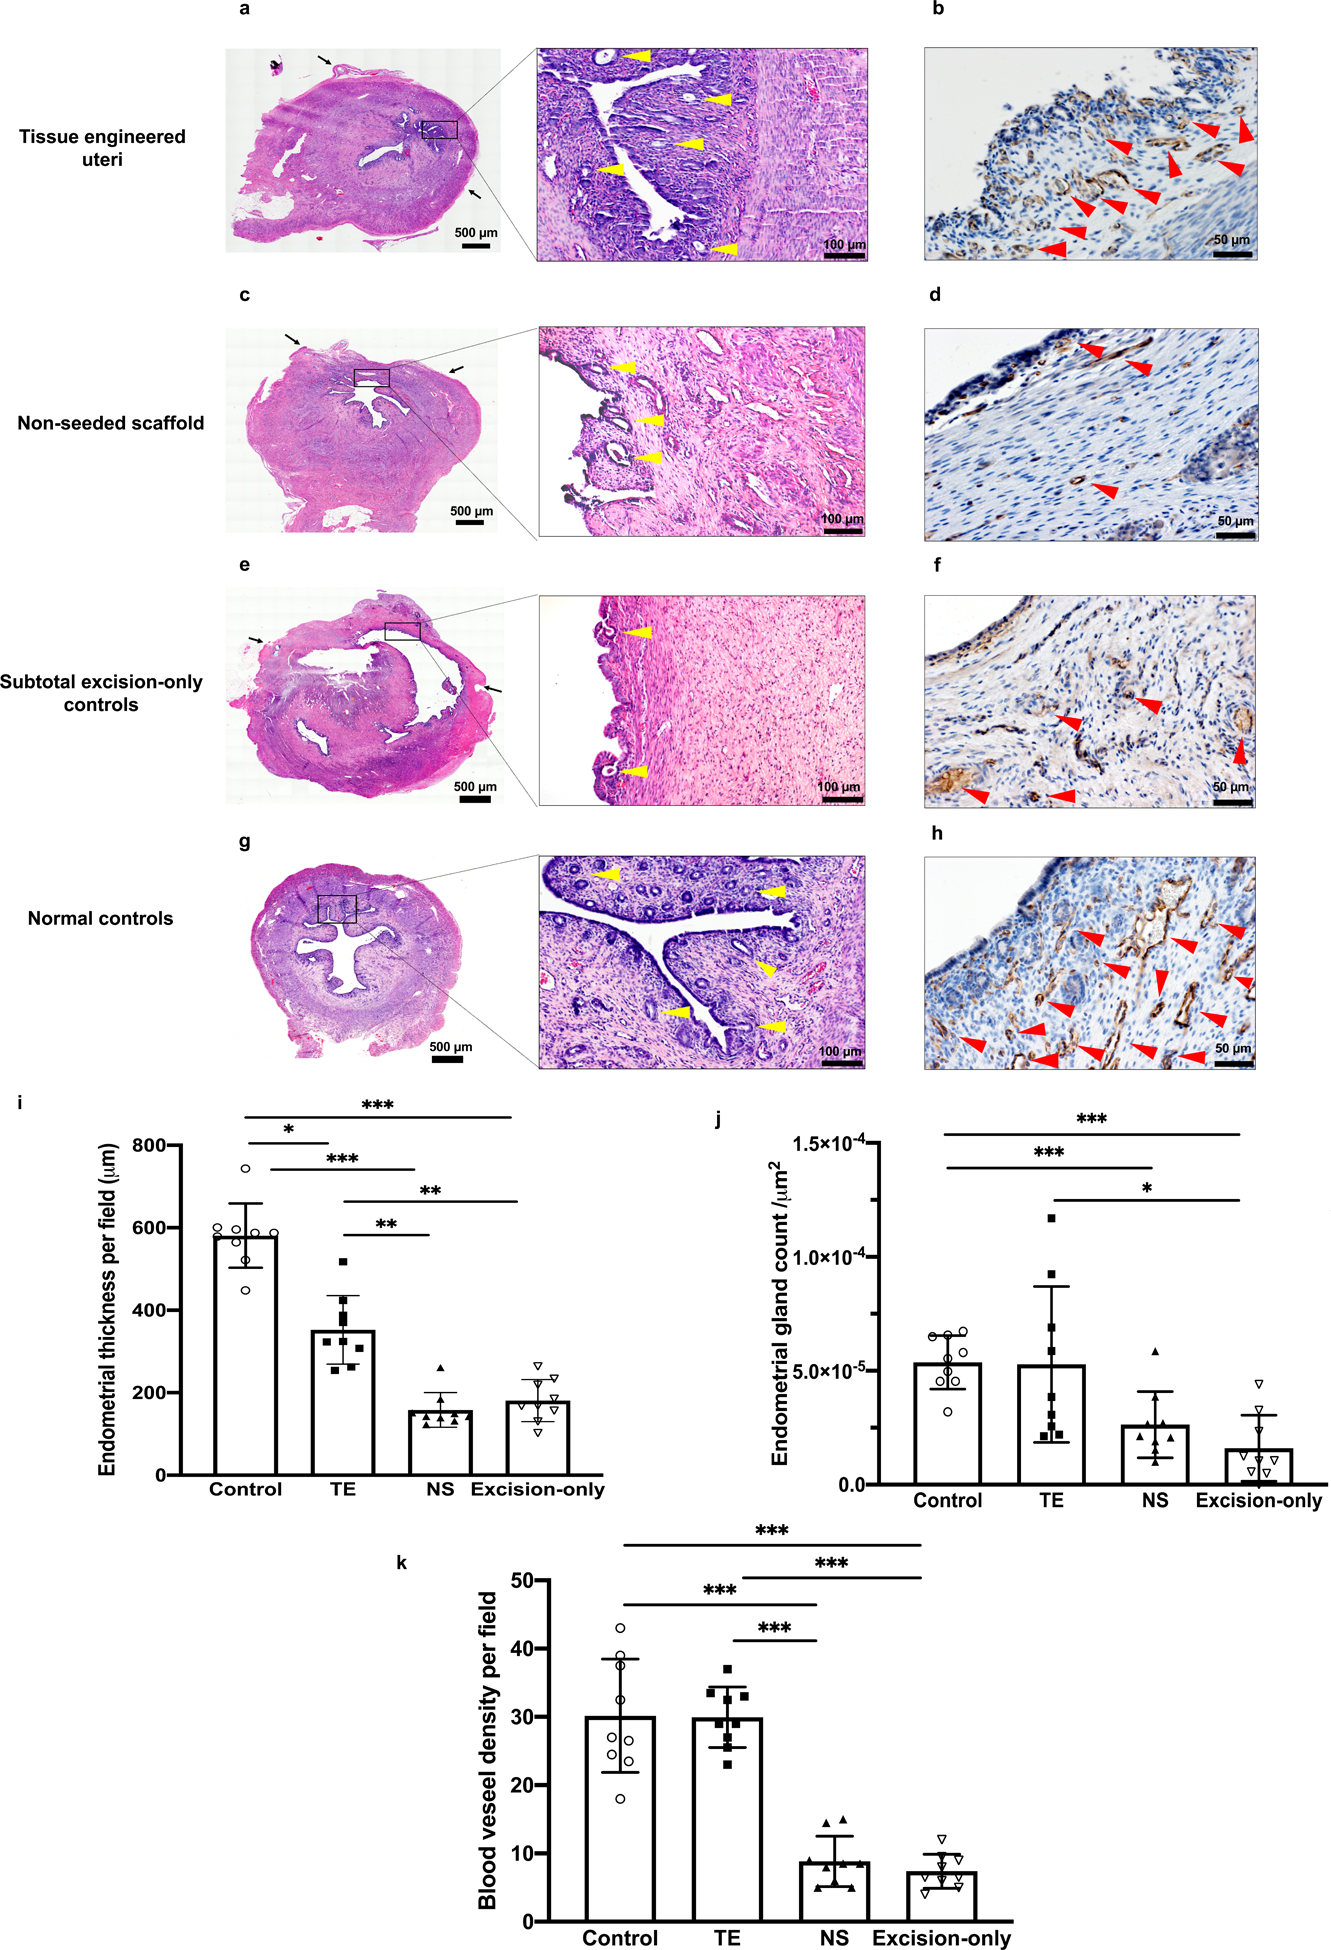
Figure 3.

Histomorphological analysis of the uterine mucosa at 6 months post implantation. (a, c, e, g) Hematoxylin-eosin (H&E) cross-sections of uterine horns. (b, d, f, h) Immunostaining for CD31 indicates positive endothelial cells in the capillaries and lining of mature blood vessels. (i) Analysis of the average endometrial thickness measured at the points of greatest perpendicular depth under a magnification of 100× showed that the tissue engineered uteri group formed thicker inner layer than the non-seeded scaffold group and subtotal excision-only controls. (j) Quantitative analysis of the average number of endometrial glands per field using a 20× objective showed that the endometrial gland density was comparable between the tissue engineered uteri group and normal controls. (k) Quantitative analysis of the average number of microvessels per field under a magnification of 200× showed greater endometrium neovascularization in tissue engineered uteri group than the non-seeded group and subtotal excision-only group. Black arrows indicate the interface between the native uterine tissue and engrafted site; Scale bar 500μm; 100 μm; 50 μm. Yellow arrowheads indicate endometrial glands; red arrowheads indicate blood vessels. Data shown are representative images from n = 3 animals per group; experiments were repeated independently three times with similar results. One-tailed one-way ANOVA was performed followed by the Tukey test. Error bars, mean ± SD. * P < 0.05, ** P < 0.01, *** P < 0.001.
