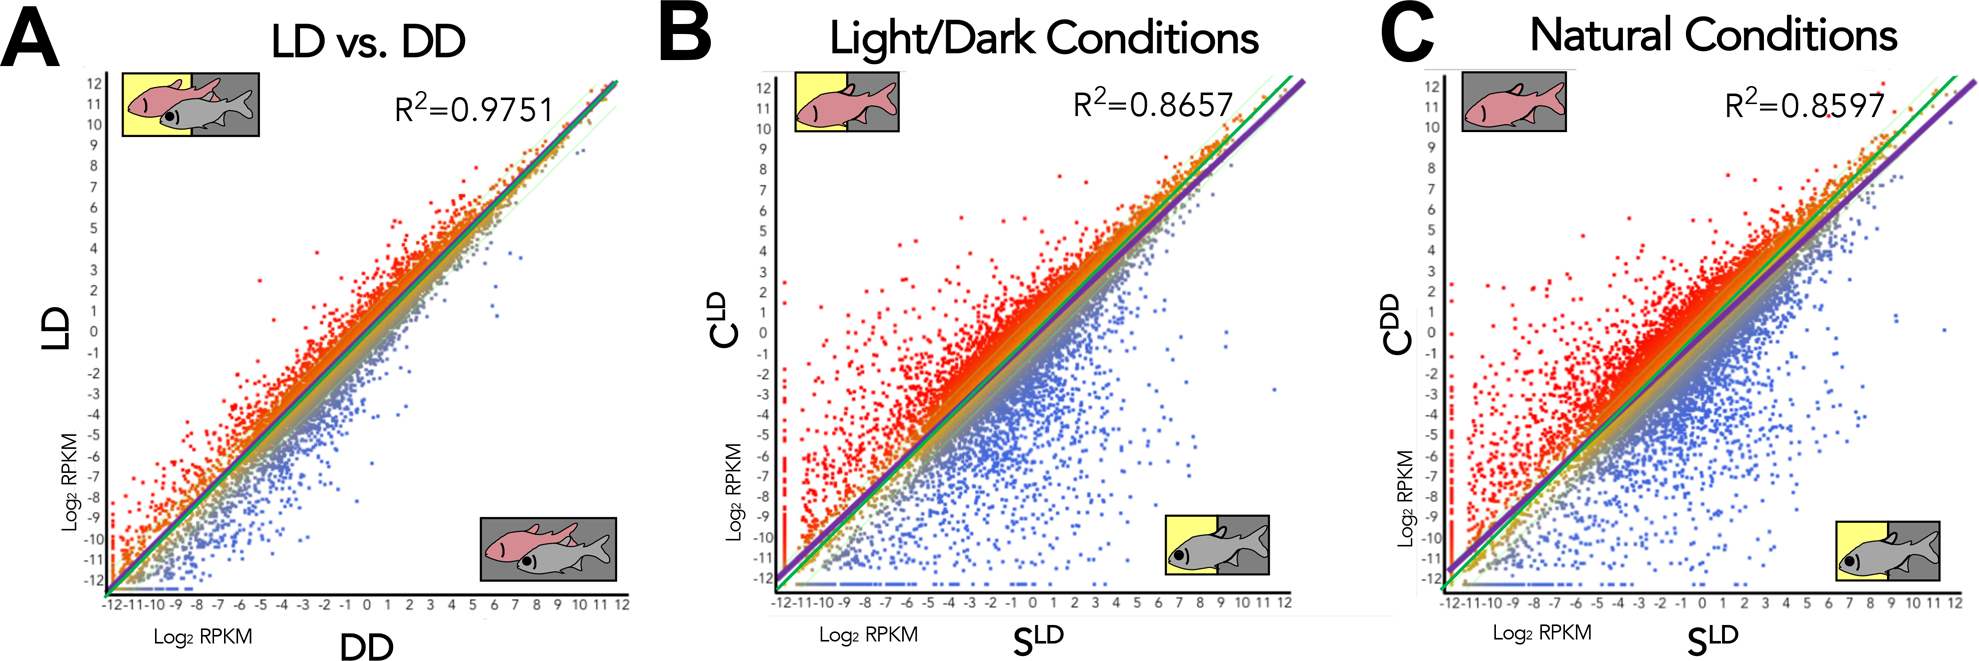
Figure 1. Correlations between morphotypes are least similar under natural conditions.

Each point on this scatterplot represents an individual gene. Some genes (red) have a higher expression in the condition on the y-axis. Other genes (blue) have a higher expression in the condition on the x-axis. LD vs. DD (A) is more similar than light/dark conditions (B), while natural conditions (C) are the least related based on the R2 and spread of points about the line of regression (purple). As each of these scatterplots encapsulates all 25,271 genes, any visible changes correlate to large scale changes in global gene expression. The increasing distance between the line of regression (purple) and the zero-fold line (green) viewed between panels A to C yields an approximation of the increase in difference between the two conditions.
