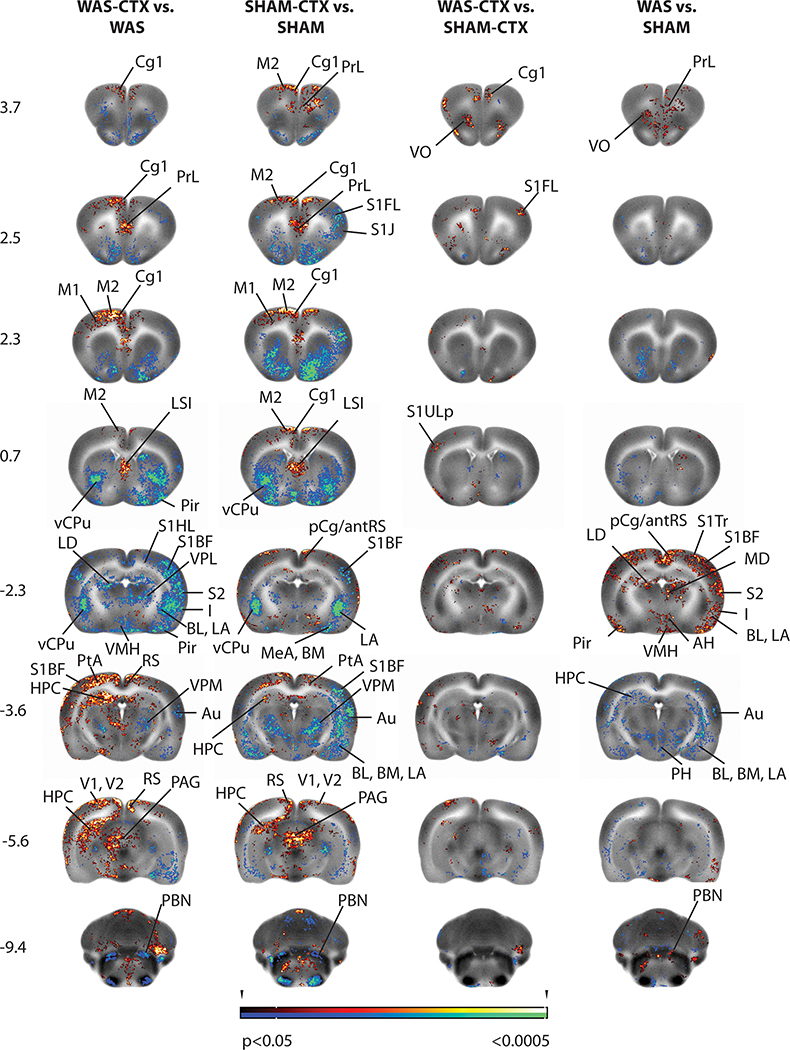
Figure 2: Brain regions showing significant between-group differences in t-tests.
Shown are statistical parametric maps showing significant difference in brain activation in sedated WAS rats compared to controls during bladder filling with and without prior exposure to ceftriaxone (CTX). Changes in regional cerebral blood flow related tissue radioactivity are depicted on representative coronal sections (anterior–posterior coordinates relative to the bregma) of the template brain. Color-coded overlays show statistically significant group differences, with red and blue colors showing positive and negative changes, respectively (P<0.05 at the voxel level for clusters of >100 contiguous voxels). Abbreviations are based on the rat brain atlas 74 with modifications.
Acb n. acumbens AH anterior hypothalamus Au auditory cx BL basolateral amygdala BLA basolateral amygdala BM basomedial amygdala Cg1 dorsal anterior cingulate cx pCg/antRS post. cingulate/ ant. retrosplenial cx CPu striatum dmCPu dorsomedial striatum HPC hippocampus I insula LA lateral amygdala LCC locus coeruleus complex LD lateral dorsal thalamic n. LO lateral orbital cx LSI lateral septum M1 primary motor cx M2 secondary motor cx MD mediodorsal thalamic n. MeA medial amygdala MG medial geniculate pCg posterior cingulate cx PAG periaqueductal gray, PBN parabrachial n. PMCo cortical amygdala Pir piriform cortex PrL prelimbic cx PtA parietal association cx RS retrosplenial cx S1BF primary somatosens. cx barrel field area S1FL primary somatosens. cx forelimb area S1J primary somatosens. cx jaw area S1Tr primary somatosens. cx trunk area S1ULp primary somatosens. cx upper lip area S2 secondary somatosens. cx Sim simple cerebellar lobule SO superior olive STN subthalamic n. V1 primary visual cx V2 secondary visual cx vCPu ventral striatum VL ventrolateral thalamic n. VMH ventromedial hypothalamus VO ventral orbital cx VPL ventral post. lateral thalamic n. VPL/VPM ventral post. lateral/ventral post. medial thalamic n. VPM ventral posterior medial thalamic n. ZI zona incerta

