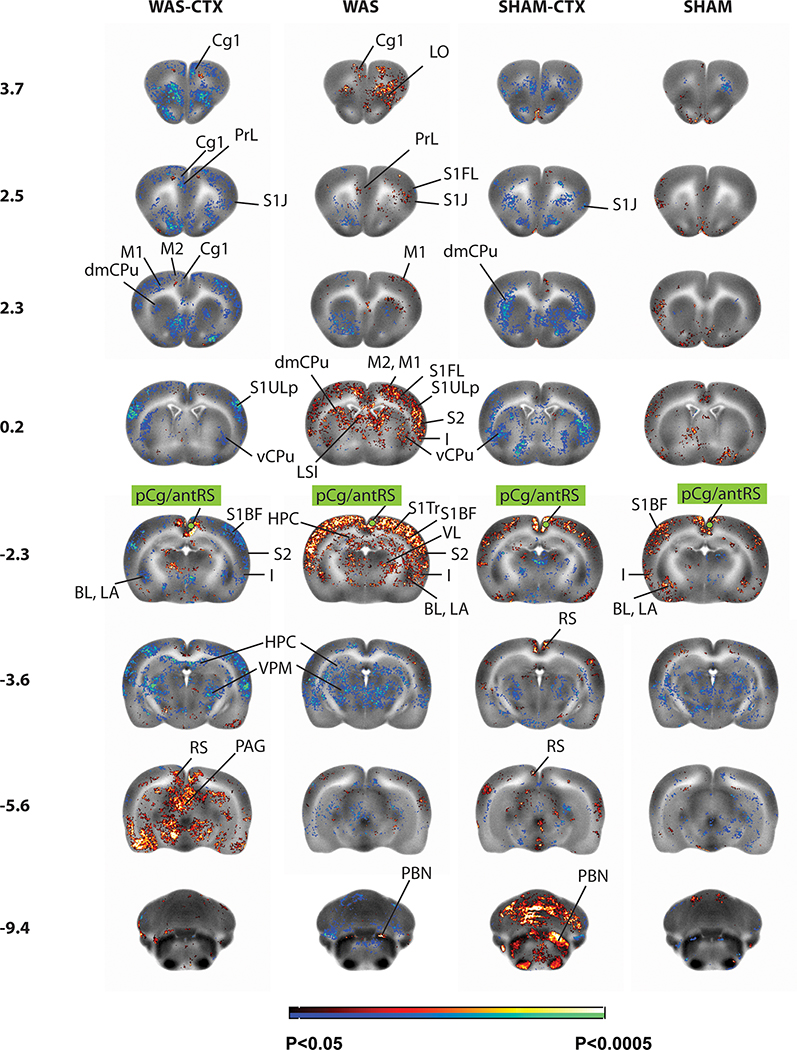
Figure 4: Correlation of functional activity during bladder filling of the right posterior cingulate cortex (seed region in green) across the whole brain.
Changes in regional functional connectivity are depicted on representative coronal sections (anterior–posterior coordinates relative to the bregma) of the template brain. Color-coded overlays show statistically significant group differences, with red and blue colors showing positive and negative functional connectivity, respectively (P<0.05 at the voxel level for clusters of >100 contiguous voxels). Abbreviations are as in figure 2 above.

