
Figure 2.
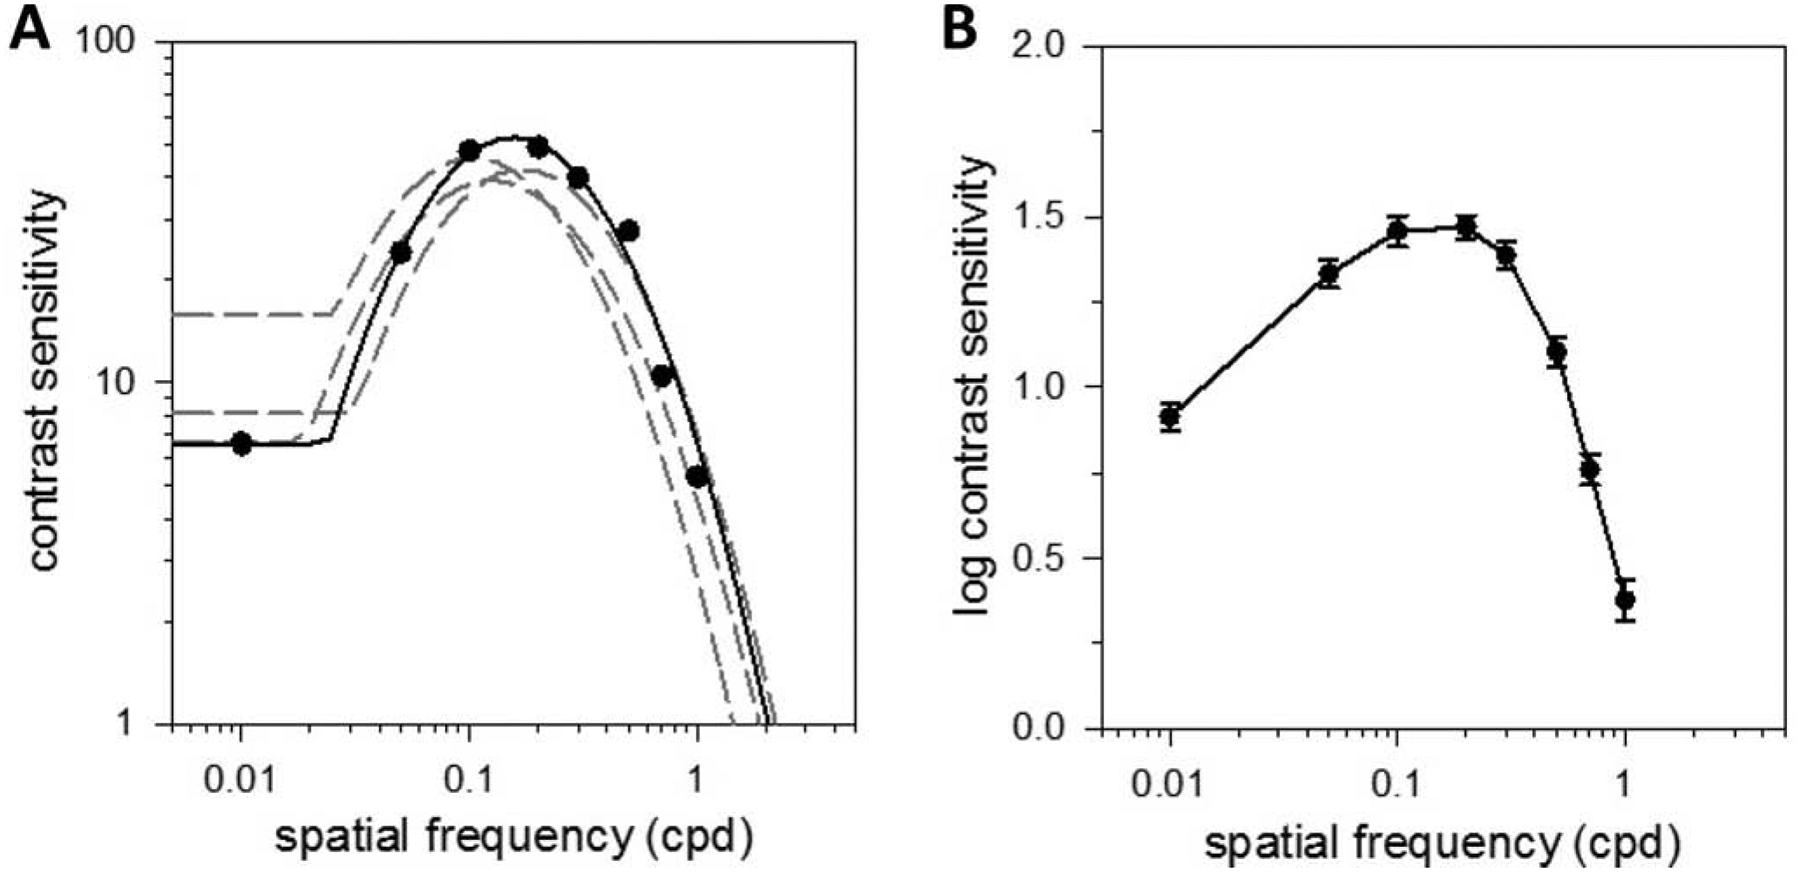
Spatial vision under photopic illumination. (A) Contrast sensitivity function of a light-adapted rat measured via the grating detection task with sinewave gratings of variable spatial frequency drifting at 6 Hz. Solid line is a fit of a truncated log-parabola model (Speak = 52, fpeak = 0.15 cpd, fbw = 0.85 cpd, flimit = 2.05 cpd, αLF = 0.87) to the data. Dashed lines are model fits of all other animals tested. (B) Log-average contrast sensitivity function of 5 light-adapted rats. Error bars are standard error.