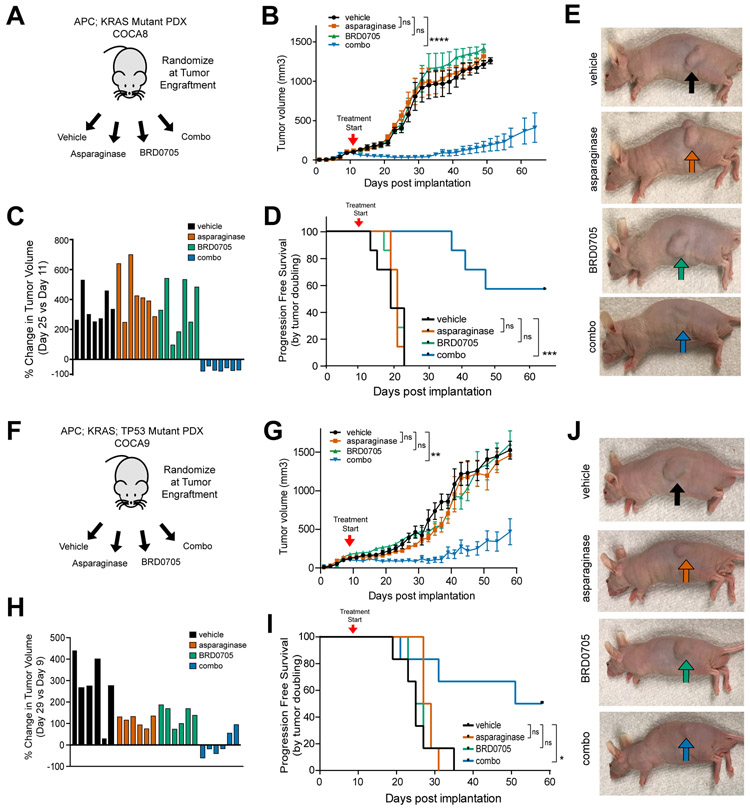
Figure 5. Activity of GSK3α Inhibition and Asparaginase in APC-Mutant Patient-Derived Xenografts of CRCs.
A, Experimental schema. A human CRC PDX harboring a biallelic APC mutation was implanted subcutaneously into male nude mice (n=7 per group). Mice were treated at the time of tumor engraftment (>100 mm3) with vehicle, asparaginase 1000 U/Kg x 1 dose, BRD0705 15 mg/kg every 12 hours x 21 days or both asparaginase and BRD0705 in combination (combo).
B, Tumor volumes of mice implanted with the human CRC PDX in the experiment shown in (A). Arrowhead denotes treatment start. Tumor volumes were assessed every other day by caliper measurements. Significance was assessed by two-way ANOVA comparing tumor volumes on day 25, with Tukey adjustment for multiple comparison testing. Error bars represent SEM. *** p ≤ 0.001; n.s., p > 0.05.
C, Waterfall plot of % change in tumor volume at post-implantation day 25 versus the pre-treatment measurement on day 11 from the experiment shown in (A); each bar represents an individual mouse.
D, Kaplan-Meier progression-free survival curve of mice treated with asparaginase, BRD0705 or combo. Significance was assessed by log rank test. *** p ≤ 0.001; n.s., p > 0.05.
E, Representative images of mice implanted with the APC-mutant CRC PDX from the experiment shown in (A). Images were taken 30 days post treatment from mice anesthetized with isoflurane.
F, Experimental design using a distinct PDX model, COCA9, harboring a monoallelic APC mutation. Randomization and treatment were performed as in (A).
G, Tumor volumes of mice from the experiment depicted in (F). Arrowhead denotes treatment start. Tumor volumes were assessed every other day by caliper measurements. Significance was assessed by two-way ANOVA comparing tumor volumes on day 25, with Tukey adjustment for multiple comparison testing. Error bars represent SEM. ** p ≤ 0.01; n.s., p > 0.05.
H, Waterfall plots of % change in tumor volume at post-implantation day 29 versus day 9. Each bar represents an individual mouse.
I, Kaplan-Meier progression-free survival curve of mice from the experiment shown in (F). Significance was assessed via log-rank test.
J, Representative images of mice implanted with the APC-mutant CRC PDX from the experiment shown in (F). Images were taken 30 days post treatment from mice anesthetized with isoflurane.

