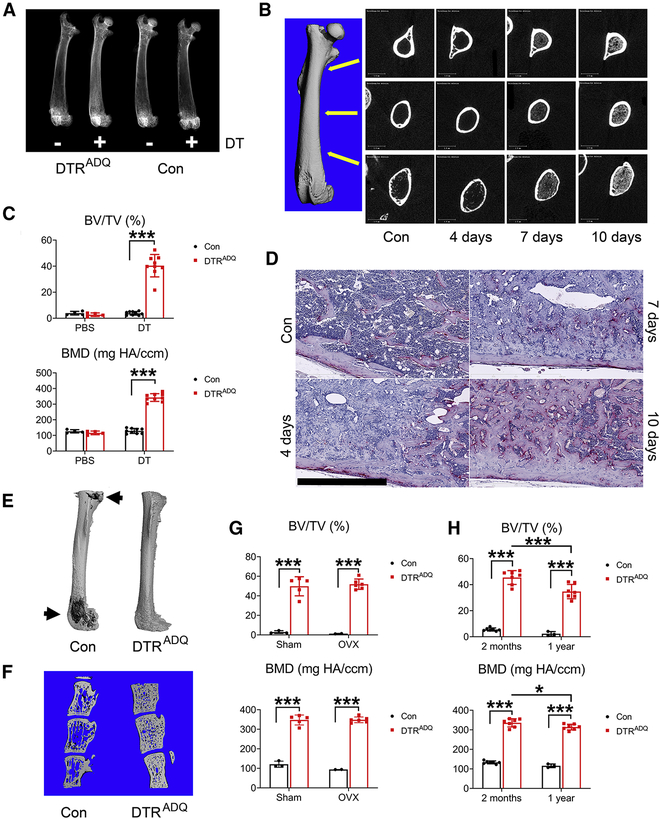
Fig 1. Adult fat ablated mice are osteosclerotic.
(A-F) 2 month old control (Con) or DTRADQ mice were daily injected with Diphtheria Toxin (DT) (100ng/mouse/day) or PBS.
(A) Representative radiographs of femurs after 10 days of DT or PBS injection. n = 6/group.
(B) Representative μCT images of DTRADQ femurs, extending from metaphysis to diaphysis, with time of DT injection. n = 6/group.
(C) Quantitative μCT analysis of whole femur of Con or DTRADQ mice after 10 days of DT or PBS injection. n = 4–9/group.
(D) Representative histological section of femur of 2 month old DTRADQ mice treated with DT with time. n = 5/group. Control (Con) received PBS for 10 days; Scale bar: 800 μm.
(E) Representative μCT images of osmium-stained femurs of Con and DTRADQ mice 4 days after DT injection. n = 5/group. Marrow fat in dark gray (arrows), decalcified bone overlaid in light grey.
(F) Representative μCT images of vertebrae (L3–5) of Con and DTRADQ mice 10 days after DT injection. n = 5/group.
(G) 2 month old Con or DTRADQ mice were subjected to ovariectomy or sham operation. 3 weeks after surgery, mice were daily injected with DT for 10 days. Whole femur BV/TV and BMD were analyzed by μCT. n = 2–6/group.
(H) 2 month or 1 year old Con or DTRADQ mice were daily injected with DT for 10 days. Whole femur was analyzed by μCT. n = 3–7/group.
Data are presented as mean ± SD. * P < 0.05, *** P < 0.001 as determined by 2 way ANOVA with Holm-Sidak’s post hoc analysis for multiple comparisons test (C, G, H).

