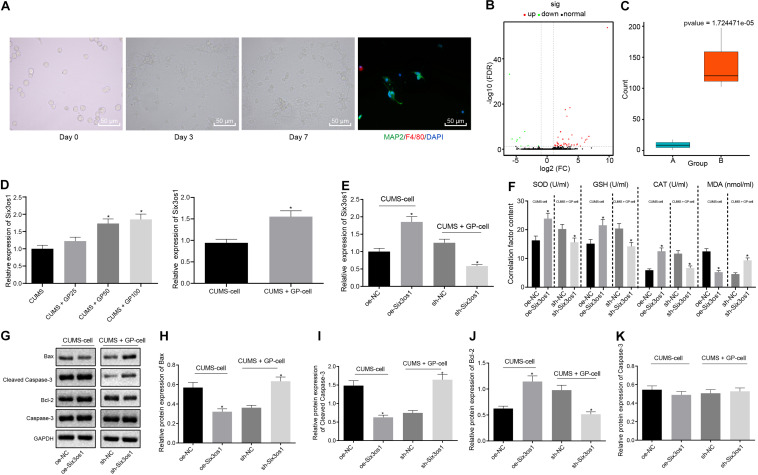
FIGURE 2.
GP treatment ameliorated the oxidative stress of CUMS-induced neurons through upregulation of Six3os1. (A) The morphology of the neurons in vitro and purity of neurons detected by immunofluorescence staining. (B) The heatmap of predicted DEGs, with abscissa representing logFC value and ordinate representing –log10 p-value; each pot in the figure represents one gene, with red pot representing the highly expressed gene in cells with GP treatment and green pot representing the poorly expressed gene in cells with GP treatment. (C) The Six3os1 expression detected by RNA-seq data analysis, with a green boxplot representing control cells and red boxplot representing cells with GP treatment; the values at upper right are corrected p-values. (D) Six3os1 expression in mice (n = 15) and neurons after CUMS and GP treatment examined by RT-qPCR. (E) Six3os1 expression in cells after treatments of sh-Six3os1 and oe-Six3os1 determined by RT-qPCR. (F) The contents of SOD, GSH, CAT, and MDA in neurons after treatments of sh-Six3os1 and oe-Six3os1 detected by ELISA. (G–K) Immunoblots (G) and quantitation of Bax (H), Cleaved caspase-3 (I), Bcl-2 (J), and caspase-3 (K) protein expression normalized to GAPDH in neurons after treatments with sh-Six3os1 and oe-Six3os1 examined by Western blot analysis. The measurement data were presented as mean ± standard deviation. Data between two groups were compared by independent sample t-test, and data among multiple groups were analyzed by one-way ANOVA, followed by Tukey’s post hoc test. Cell experiments were repeated three times. *p < 0.05 vs. CUMS-induced mice, CUMS-induced neurons, oe-NC treatment or sh-NC treatment.

