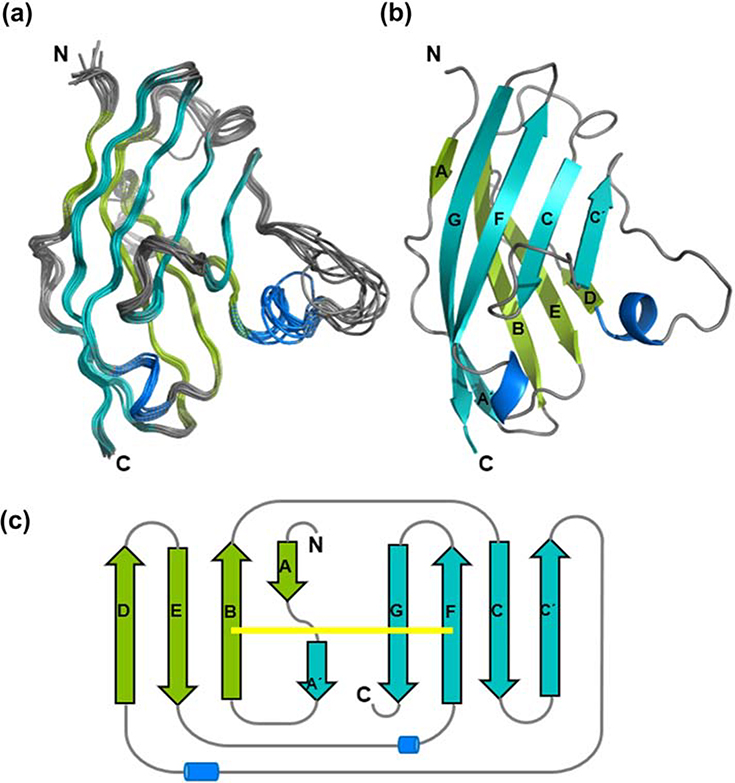
Figure 4: Solution NMR structure of BTNL2 IgV domain.
A. Overlay of 10 lowest energy structures of BTNL2 determined by solution NMR spectroscopy. Loops are colored in grey; the beta strands are colored in teal and green, respectively. The helical turns are in blue. B. Cartoon representation of the lowest energy structure of BTNL2. The strands are labelled following standard nomenclature. C. Topology diagram of BTNL2. The front face comprising of A’, G, F, C and C’ strands is colored in teal, while the back face, comprising of A, B, E and D strands is colored in green. The canonical disulfide bond bridging the B and F strands is in yellow.

