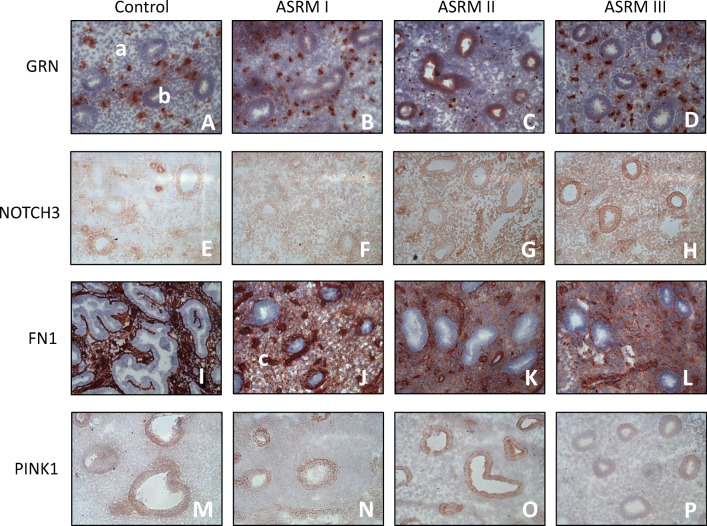
Fig. 2.
Immunohistochemical staining in tissue samples of different EM stages. Representative images (× 20) of GRN (A–D), NOTCH3 (E–H), FN1 (I–L), and PINK1 (M–P) protein expression by immunohistochemistry in endometrium of women without (control—A, E, I, M) (n = 5), minimal (ASRM I—B, F, J, N) (n = 5), mild (ASRM II—C, G, K, O) (n = 3), and moderate EM (ASRM III—D, H, L, P) (n = 5). The images demonstrate the typical staining differences in stromal (a), epithelium (b), and endothelium (c) cells of eutopic endometrium tissue depending on the severity of EM

