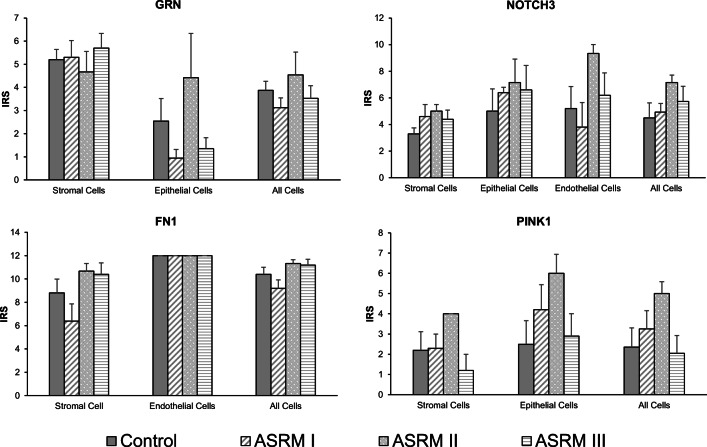
Fig. 3.
Immunoreactivity and localization of proteins in eutopic endometrial tissue samples. Immunohistochemistry for GRN, NOTCH3, FN1, and PINK1. Data presents the mean of the intensity–reactivity score (IRS) of each cell type stained with the assessed proteins compared by the stage of EM. Bar graphs showing the typical localization of the determined proteins in eutopic endometrial tissue. IRS, intensity–reactivity score (product of intensity of staining and percentage of stained cells); intensity of staining: 0, none; 1, mild; 2, moderate; 3, high; percentage of stained cells: 0, none; 1, < 10%; 2, 10–50%; 3, 50–80%; 4 > 80%. Data represents the mean ± SEM. Control (without EM, n = 5); ASRM I (minimal EM, n = 5); ASRM II (mild EM, n = 3); ASRM III (moderate EM, n = 5)

