
Figure 2: PRMT5 inhibition by C220 in the conditional Jak2V617F knock-in mouse model of PV.
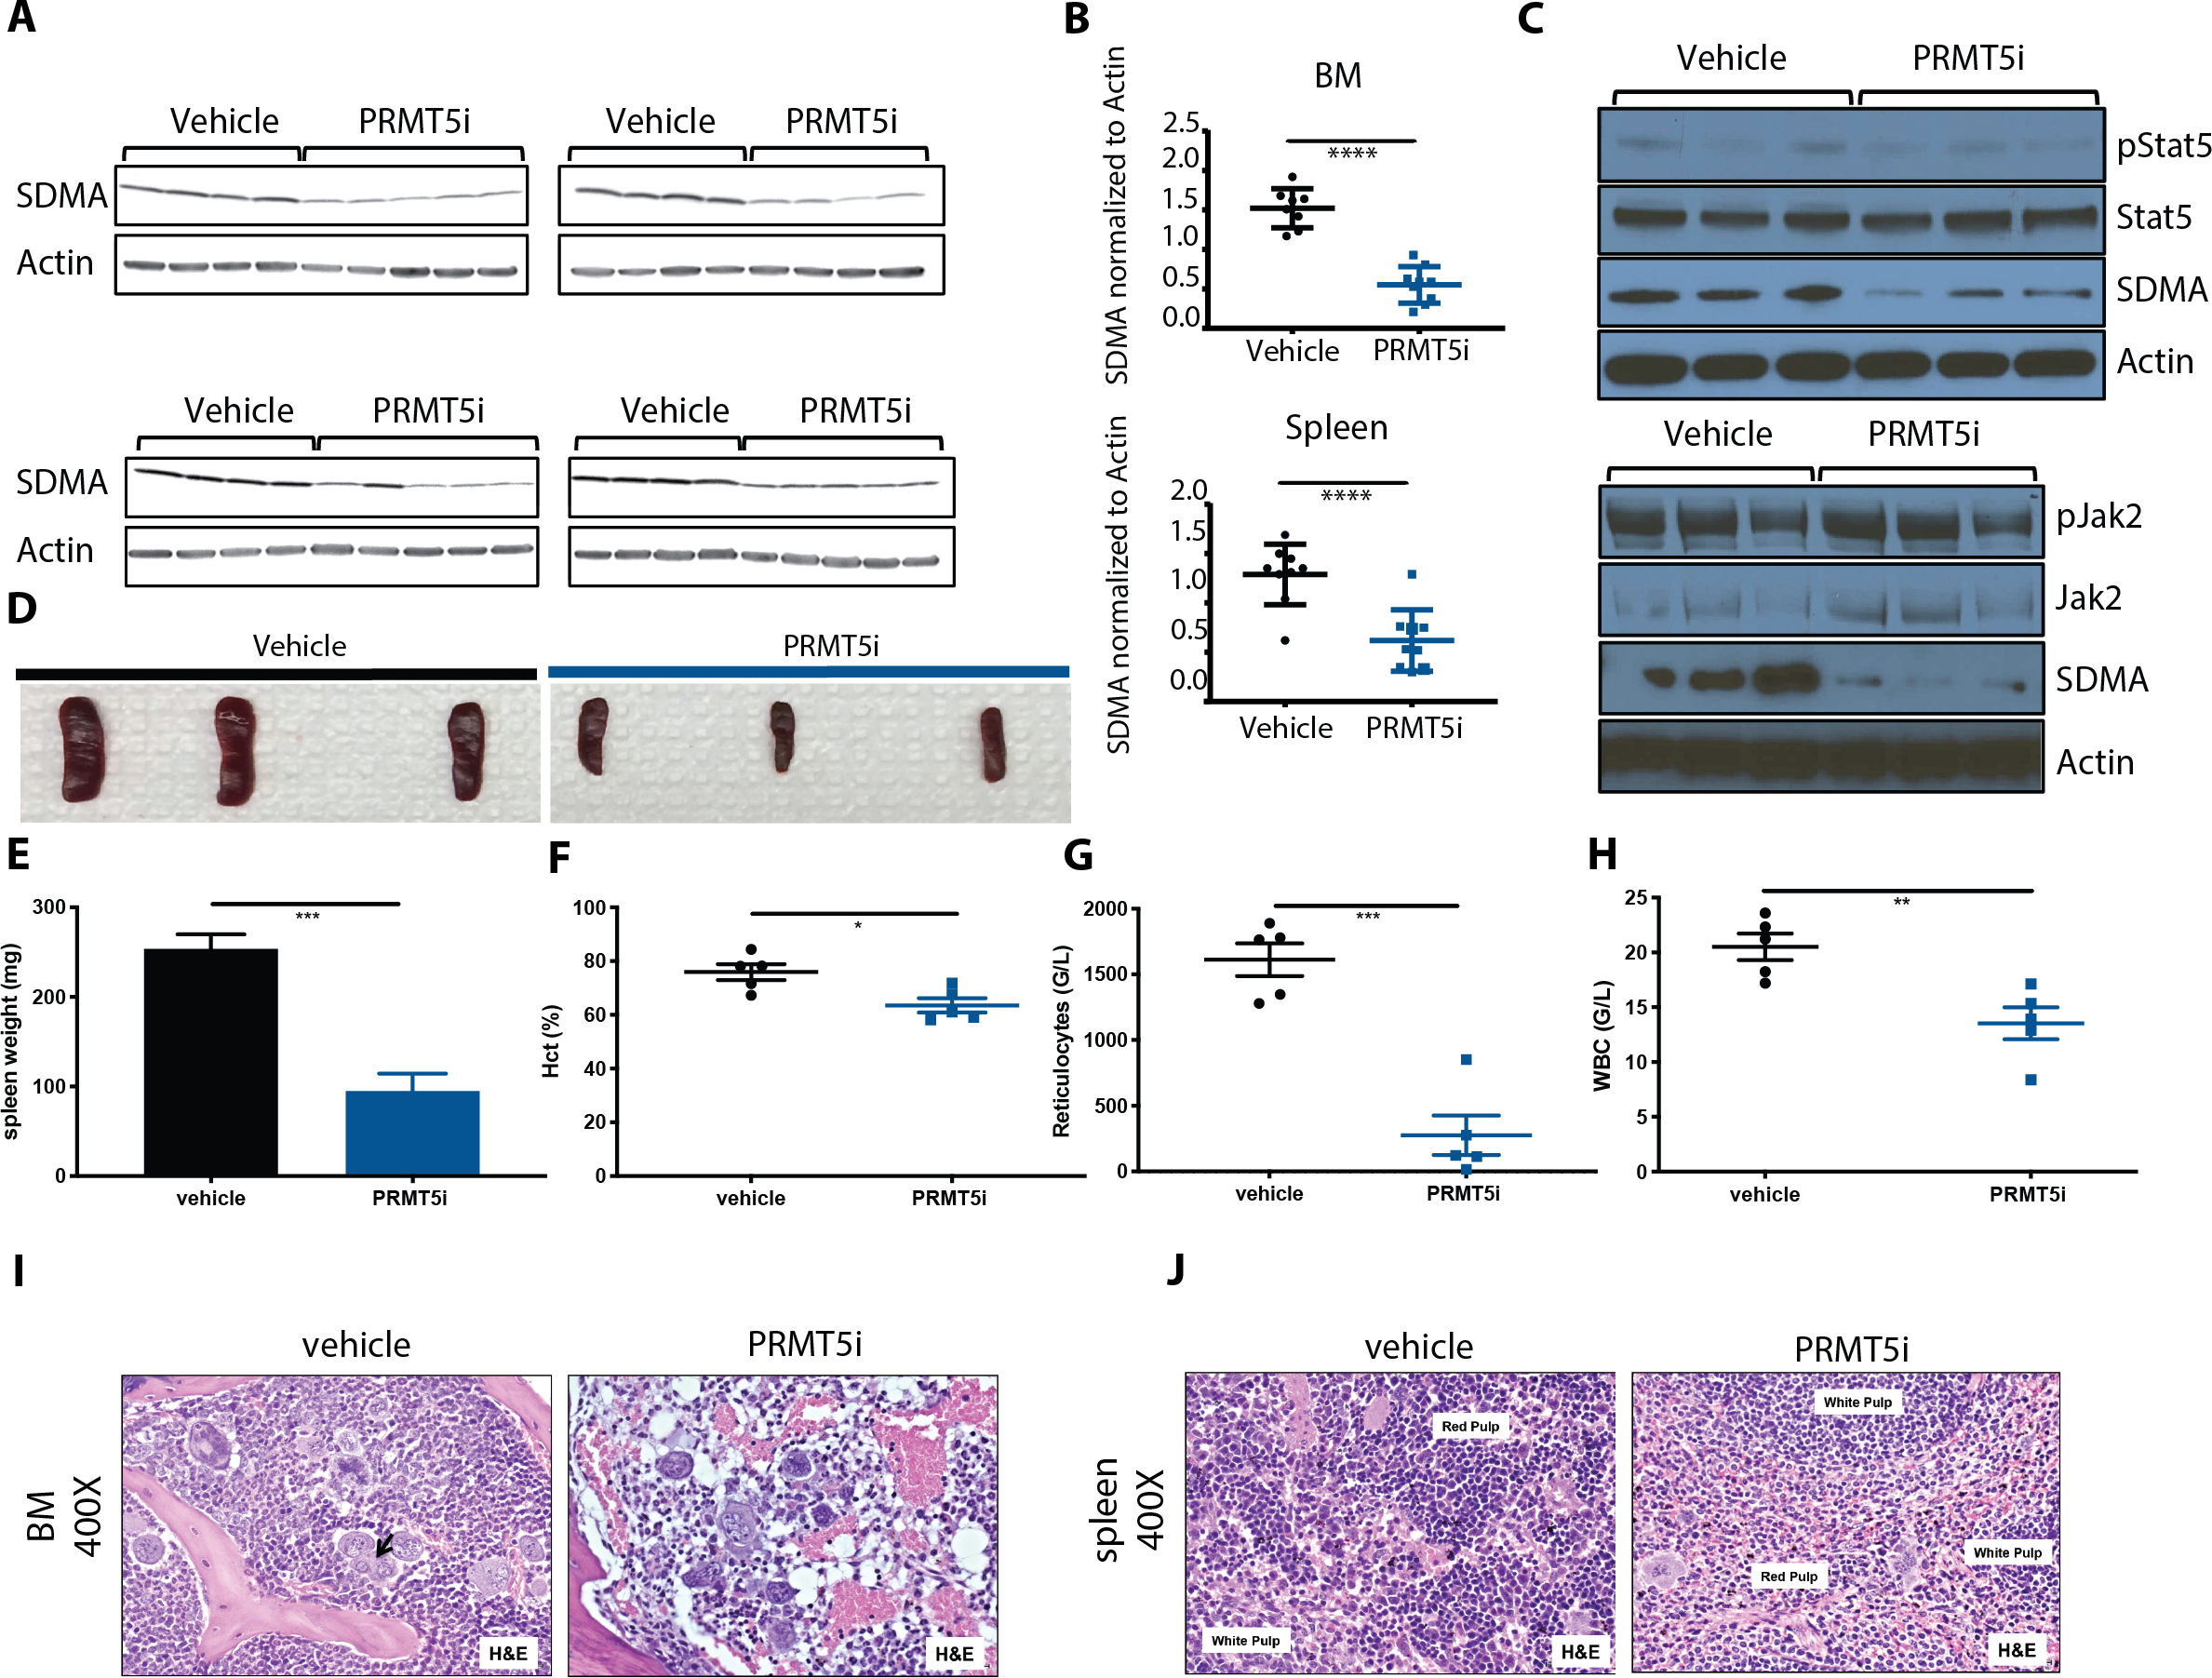
(A) SDMA expression in total BM and spleen is assessed by Western blot after 4 weeks of treatment with 12.5 mg/kg C220 in the conditional knock-in model of PV.
(A) SDMA expression in total BM and spleen normalized to actin. Data are represented as mean +/− SEM (****p<0.0001 versus vehicle group)
(B) Western Blot assessment of Jak2 and Stat5 phosphorylation and signaling in total BM after 4 weeks of treatment with C220 versus vehicle in the conditional knock-in model of PV.
(C) Spleen size at 4 weeks of treatment with C220 at 12.5 mg/kg or vehicle.
(D) Spleen weights at 4 weeks of treatment with C220 at 12.5 mg/kg or vehicle. Data are represented as mean +/− SEM (***p<0.001 versus vehicle group)
(E) Hematocrit at 4 weeks of treatment with C220 at 12.5 mg/kg or vehicle. Data are represented as mean +/− SEM (*p<0.05 versus vehicle group)
(F) Reticulocyte counts at 4 weeks of treatment with C220 at 12.5 mg/kg or vehicle. Data are represented as mean +/− SEM (***p<0.001 versus vehicle group)
(G) WBC at 4 weeks of treatment with C220 at 12.5 mg/kg or vehicle. Data are represented as mean +/− SEM (**p<0.01 versus vehicle group)
(H) Representative images of bone marrow histology (H&E) are shown in vehicle versus C220 treated mice. Magnification 400X.
(I) Representative images of splenic architecture (H&E) are shown in vehicle versus C220 treated mice. Magnification 400X.