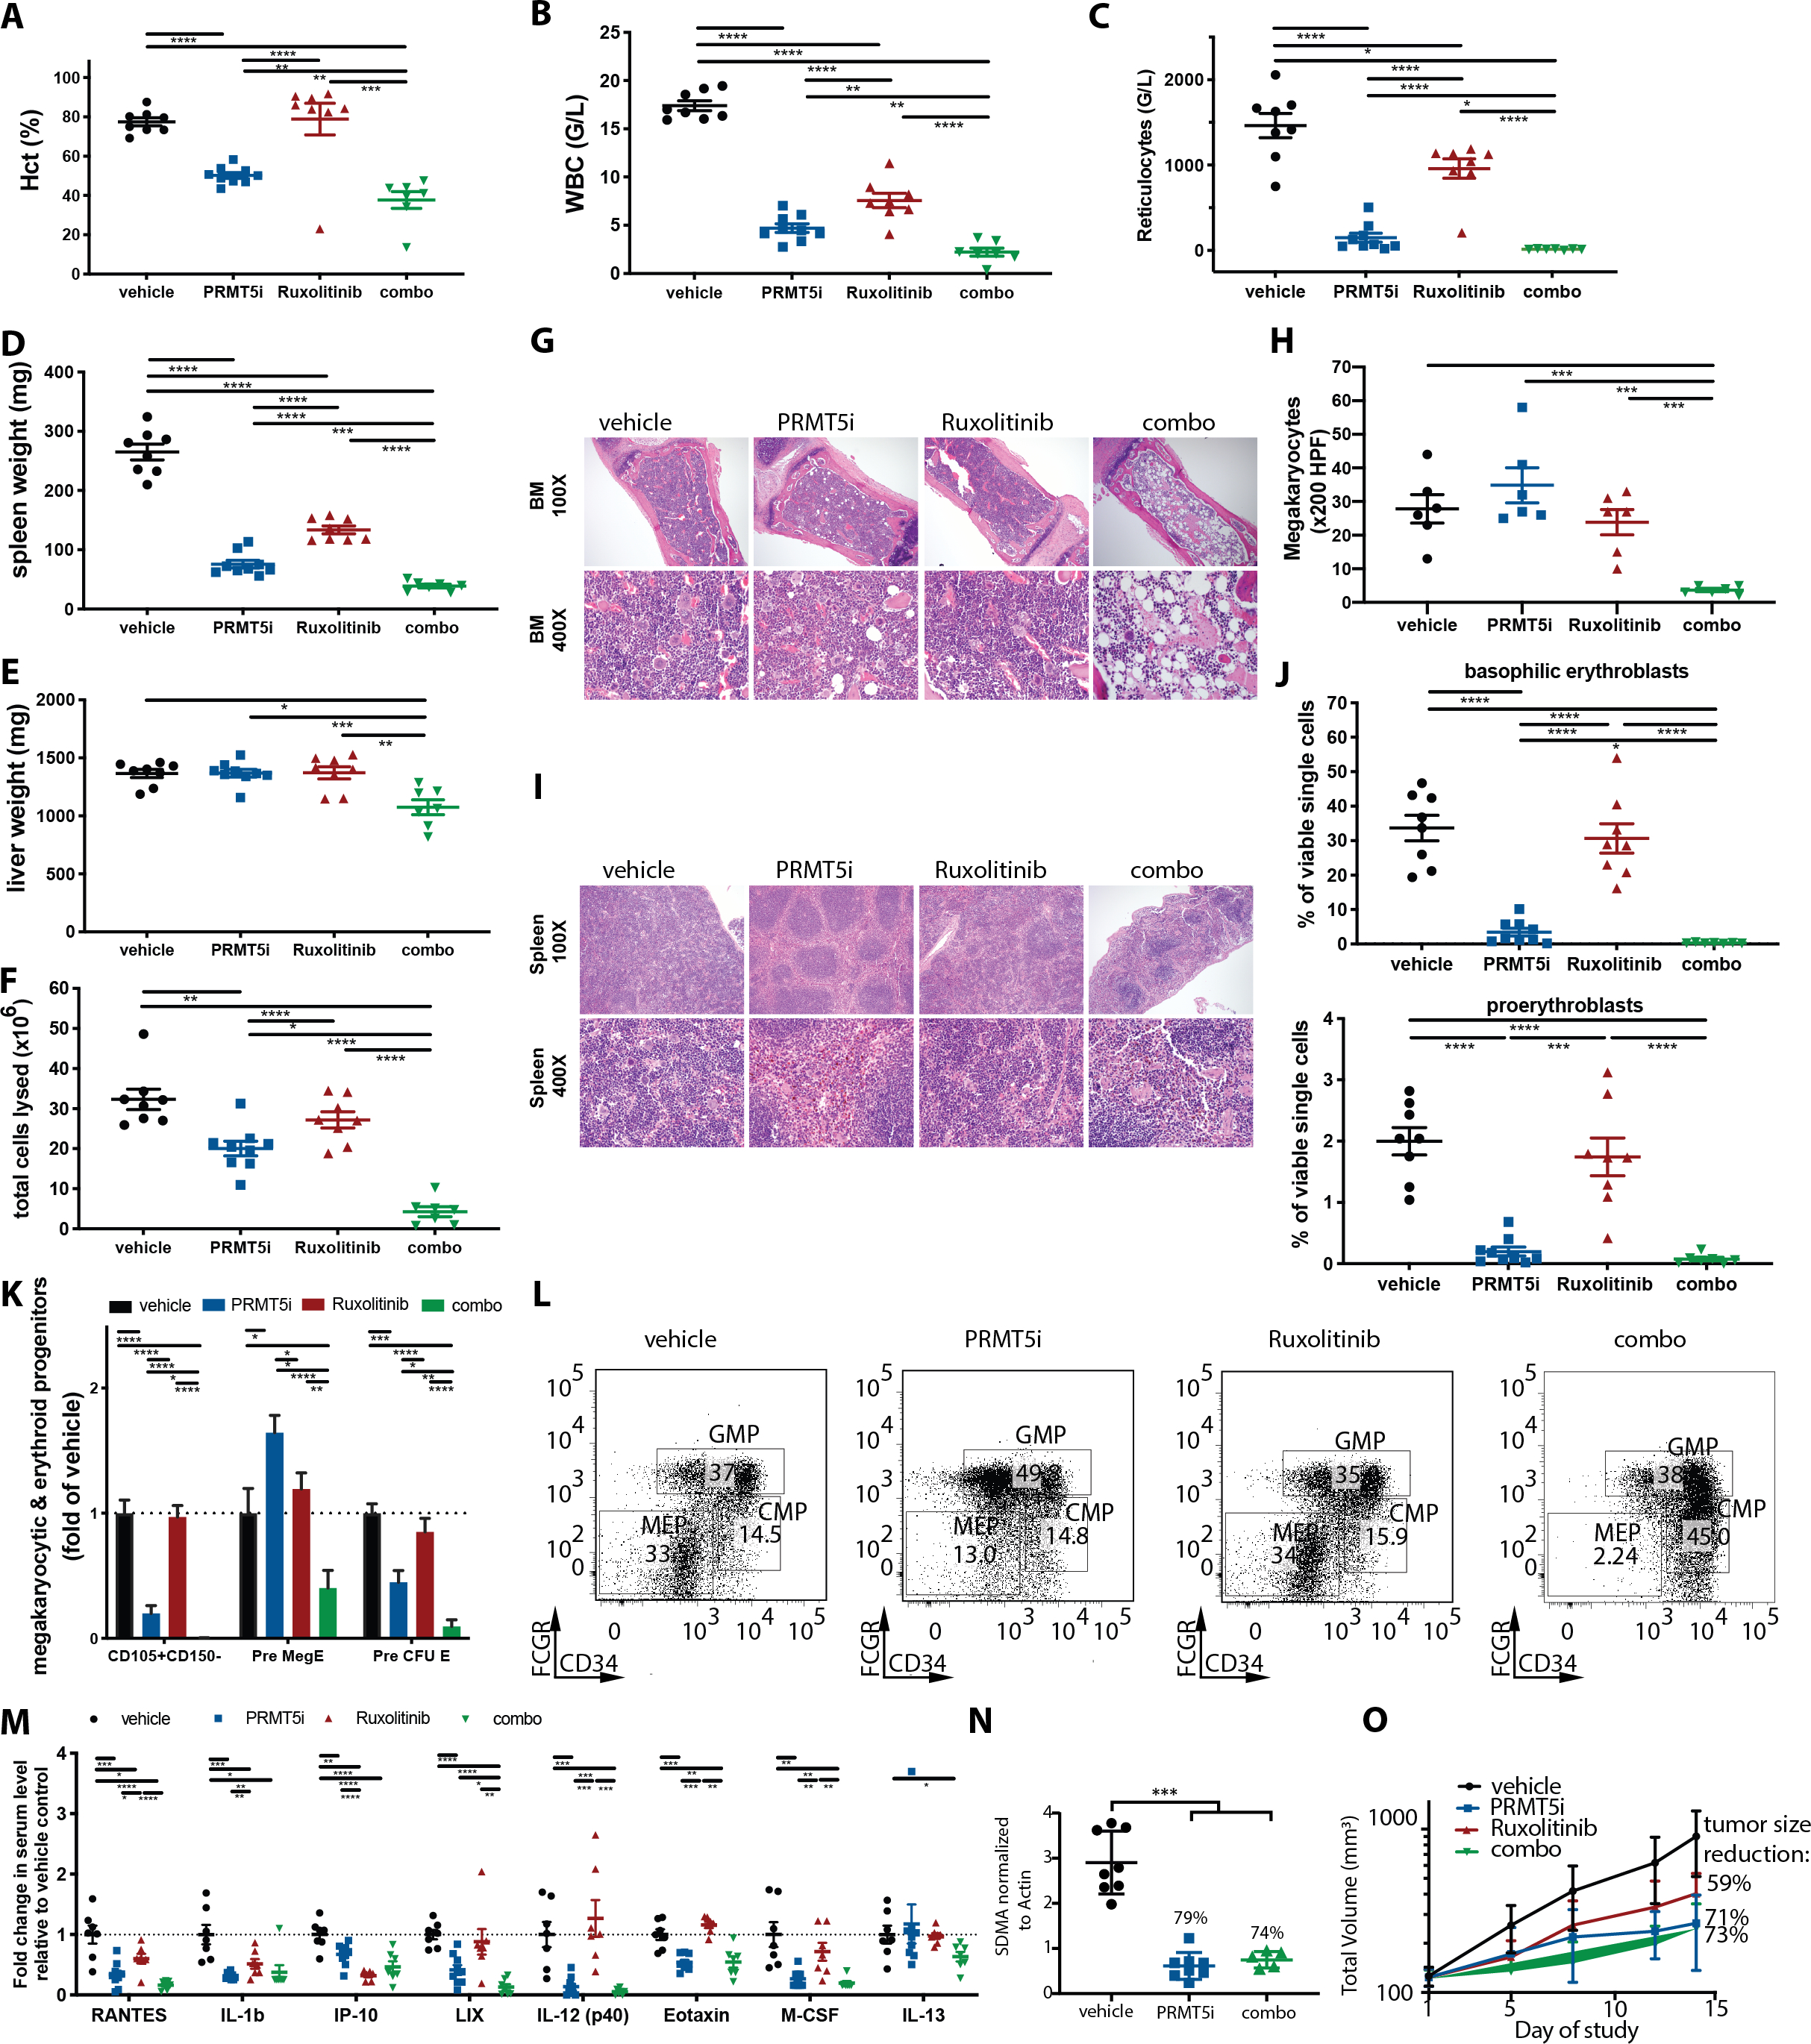
Figure 3: Dual PRMT5 and JAK1/2 inhibition is superior to C220 or ruxolitinib monotherapy in the conditional Jak2V617F knock-in model of PV.

(A) Hematocrit at 4 weeks of treatment with C220 at 12.5 mg/kg, ruxolitinib 60 mg/kg or combination of both versus vehicle. Data are represented as mean +/− SEM (****p<0.0001, ***p<0.001, **p<0.01).
(B) WBC at 4 weeks of treatment with C220 at 12.5 mg/kg, ruxolitinib 60 mg/kg or combination of both versus vehicle. Data are represented as mean +/− SEM (****p<0.0001, **p<0.01).
(C) Reticulocyte counts at 4 weeks of treatment with C220 at 12.5 mg/kg, ruxolitinib 60 mg/kg or combination of both versus vehicle. Data are represented as mean +/− SEM (*p<0.05).
(D) Spleen weights at 4 weeks of treatment with C220 at 12.5 mg/kg, ruxolitinib 60 mg/kg or combination of both versus vehicle. Data are represented as mean +/− SEM (****p<0.0001, ***p<0.001).
(E) Liver weights at 4 weeks of treatment with C220 at 12.5 mg/kg, ruxolitinib 60 mg/kg or combination of both versus vehicle. Data are represented as mean +/− SEM (***p<0.001, **p<0.01, *p<0.05).
(F) Total lysed cells in the bone marrow of 1 femur at 4 weeks of treatment with C220 at 12.5 mg/kg, ruxolitinib 60 mg/kg or combination of both versus vehicle. Data are represented as mean +/− SEM (****p<0.0001, **p<0.01, *p<0.05).
(G)Representative images of bone marrow histology (H&E) are shown in C220 at 12.5 mg/kg, ruxolitinib 60 mg/kg or combination of both versus vehicle treated mice. Magnification 100X and 400X.
(H) Absolute number of megakaryocytes per 200 HPF in the bone marrow histology is shown for C220 at 12.5 mg/kg, ruxolitinib 60 mg/kg or combination of both versus vehicle treated mice. Data are represented as mean +/− SEM (***p<0.001).
(I) Representative images of splenic architecture (H&E) are shown in C220 at 12.5 mg/kg, ruxolitinib 60 mg/kg or combination of both versus vehicle treated mice. Magnification 100X and 400X.
(J)The Ter119medCD71high proerythroblast and Ter119highCD71high basophilic erythroblast populations in C220 (12.5 mg/kg), ruxolitinib (60 mg/kg), combination of both or vehicle treated animals are illustrated as means +/− SEM (****p<0.0001, ***p<0.001).
(K) Lin-cKithighCD41-FcgR-CD150-CD105+, Lin-cKithighCD41-FcgR-CD150+CD105+ committed erythroid progenitors (Pre-CFU-E) and Lin-cKithighCD41-FcgR-CD150+CD105- bipotential megakaryocyte-erythroid progenitors (Pre-Meg-E) are assessed after 4 weeks of treatment with C220 at 12.5 mg/kg, ruxolitinib at 60 mg/kg or combination of both versus vehicle treated mice. Data are illustrated as means +/− SEM (****p<0.0001, ***p<0.001**p<0.01, *p<0.05).
(L) The impact of C220, ruxolitinib, combination and vehicle treatment on Lin-Sca1-Kit+FcgR-CD34- megakaryocytic-erythroid progenitors (MEP) in the BM in the conditional Jak2V617F knock-in model of PV is assessed. Representative flow plots are depicted (C220 versus vehicle p<0.05, C220 versus ruxolitinib p<0.01, combo versus vehicle p<0.0001, combo versus ruxolitinib p<0.0001, combo versus C220 p<0.001).
(M) Serum cytokine levels measured after 4 weeks of treatment with C220 at 12.5 mg/kg, ruxolitinib at 60 mg/kg or combination of both versus vehicle treated mice are illustrated as individual points indicating fold change relative to vehicle. Only cytokines significantly attenuated by combo versus vehicle group are shown. Data are illustrated as means +/− SEM (****p<0.0001, ***p<0.001**p<0.01, *p<0.05).
(N) SDMA expression in s.c. tumors of SET2 cell derived xenografts after oral treatment with C220 at 15 mg/kg, ruxolitinib at 60 mg/kg or combination of both versus vehicle is assessed after 14 days of treatment (***p<0.001 versus vehicle group).
(O) Tumor volume of s.c. tumors in SET2 cell derived xenografts after oral treatment with C220 at 15 mg/kg, ruxolitinib at 60 mg/kg or combination of both versus vehicle treated mice is depicted.
