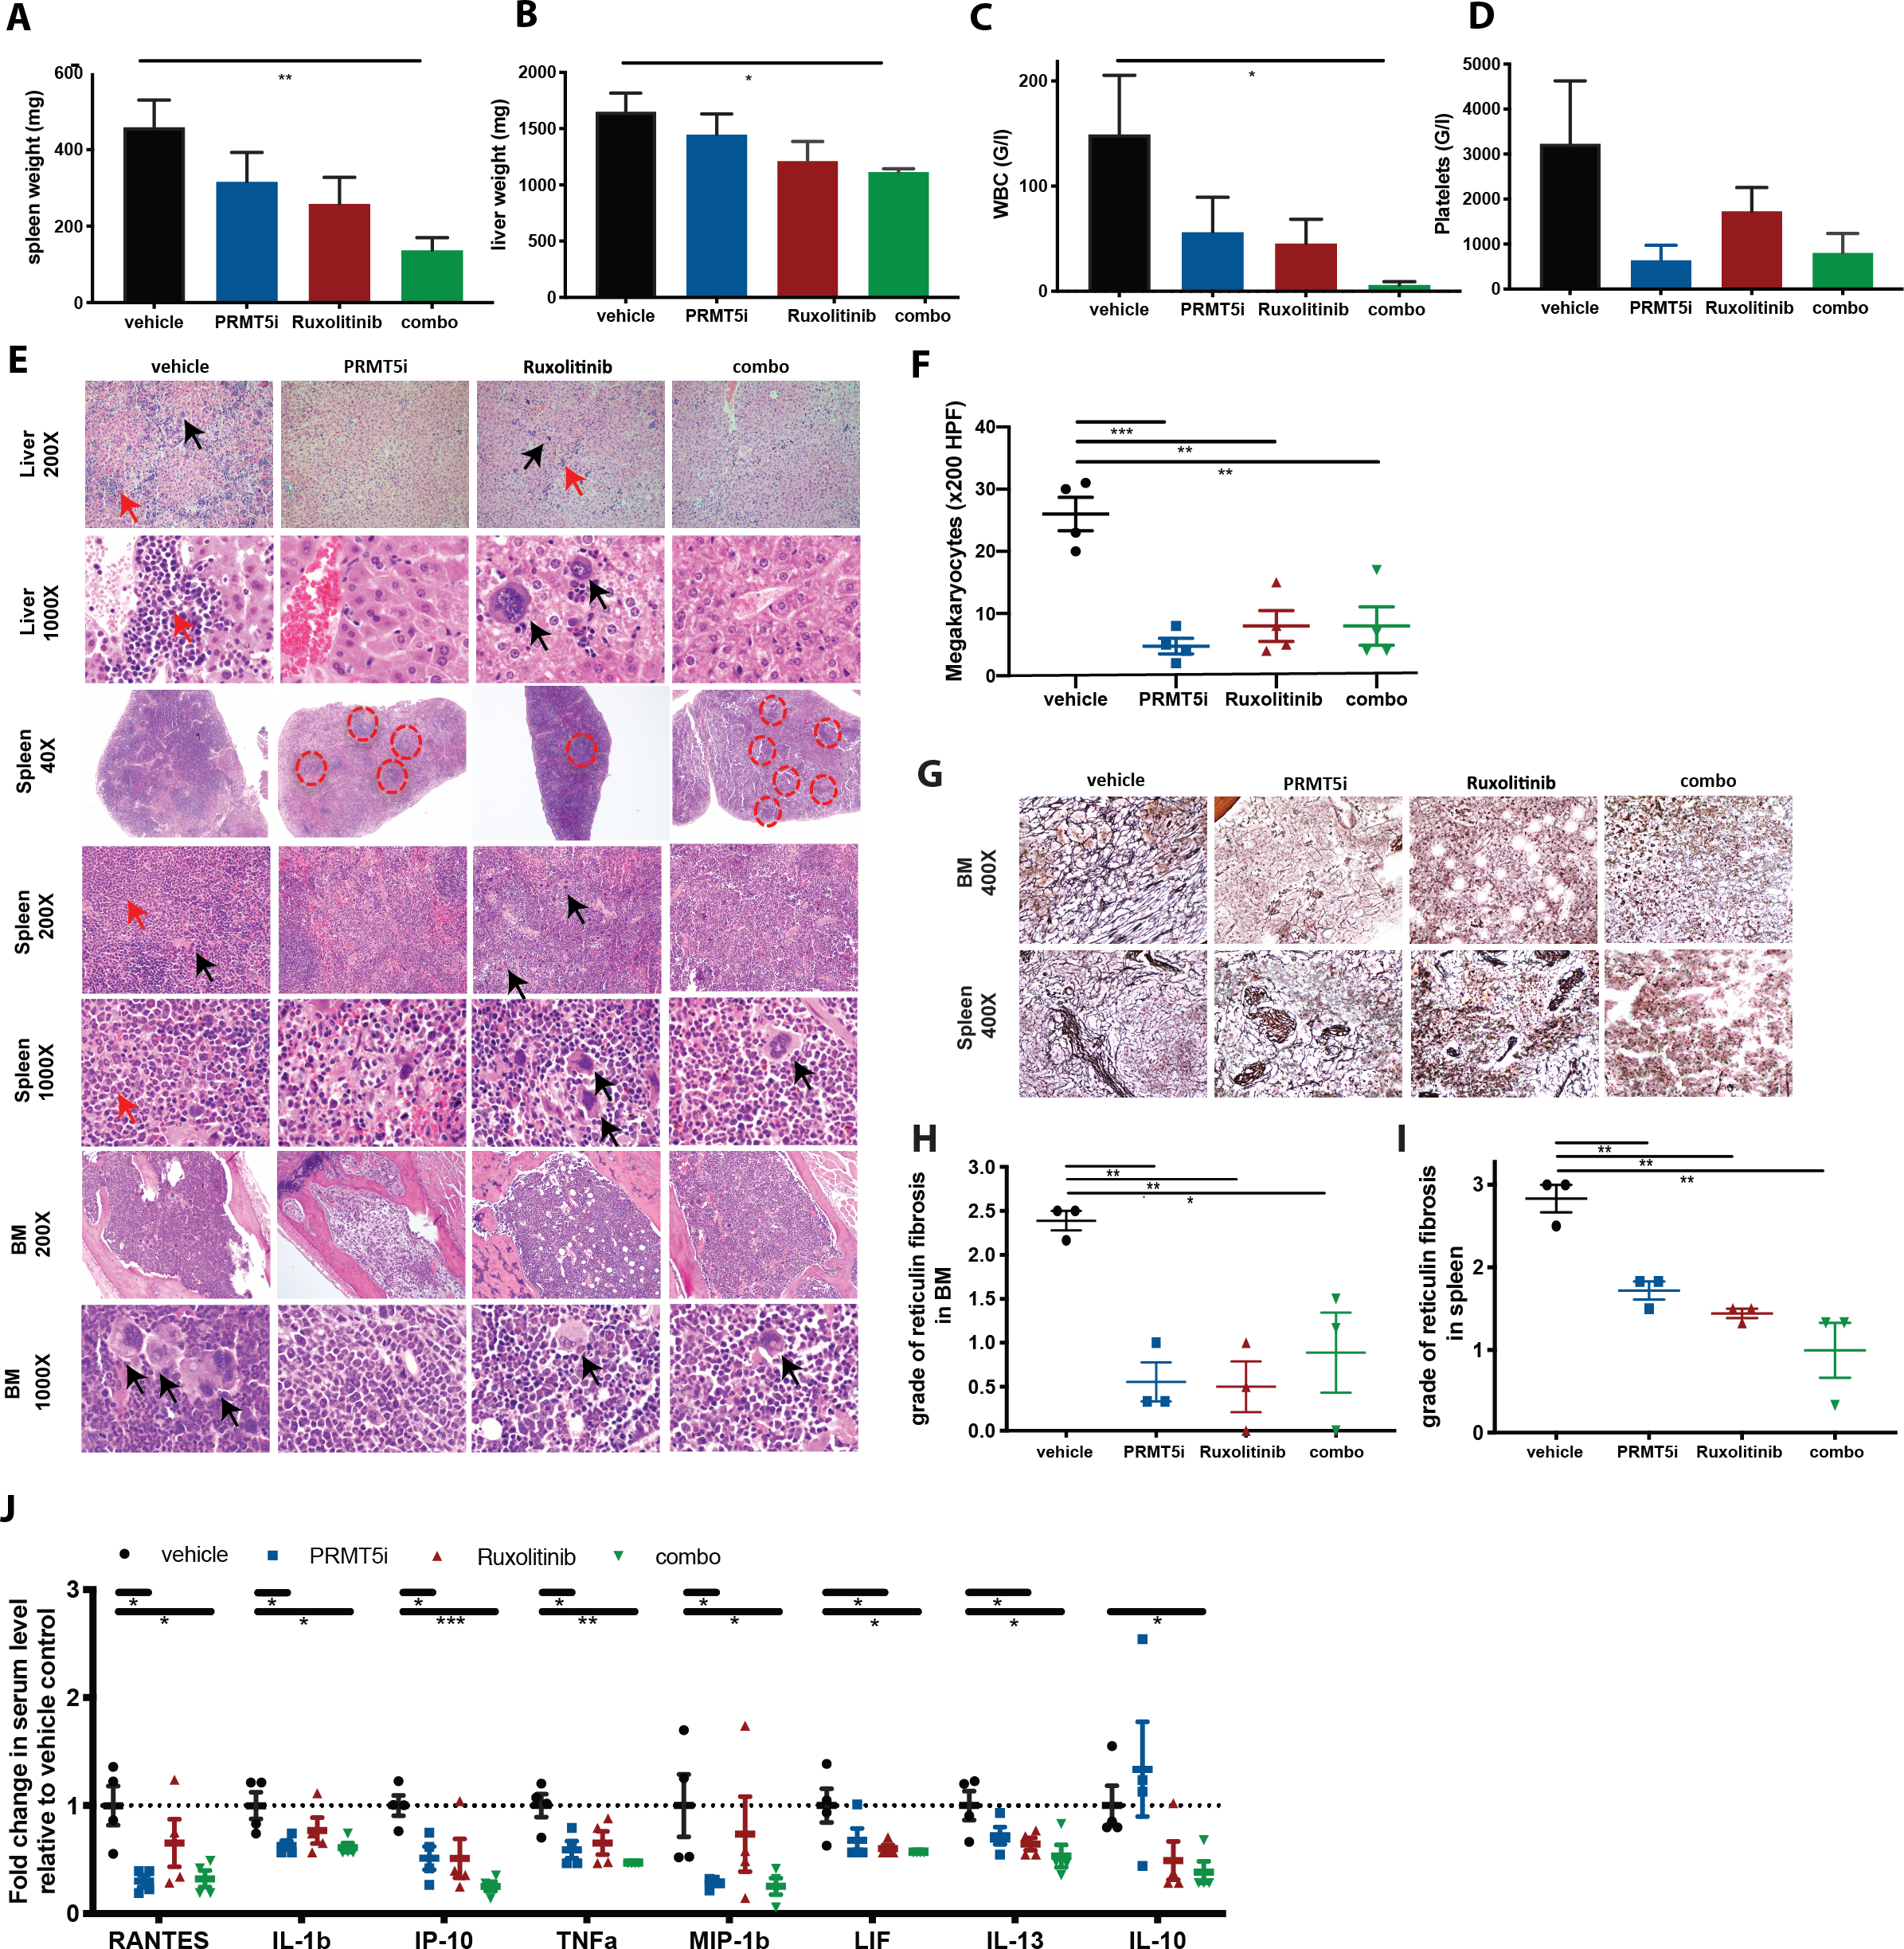
Figure 4: Dual PRMT5 and JAK1/2 inhibition shows increased efficacy in the MPLW515L model.

(A) Spleen weights at 3 weeks of treatment with C220 at 10 mg/kg, ruxolitinib 60 mg/kg or combination of both versus vehicle. Data are represented as mean +/− SEM (**p<0.01).
(B) Liver weights at 3 weeks of treatment with C220 at 10 mg/kg, ruxolitinib 60 mg/kg or combination of both versus vehicle. Data are represented as mean +/− SEM (*p<0.05).
(C) WBC at 3 weeks of treatment with C220 at 10 mg/kg, ruxolitinib 60 mg/kg or combination of both versus vehicle. Data are represented as mean +/− SEM (*p<0.05).
(D) Platelet counts at 3 weeks of treatment with C220 at 10 mg/kg, ruxolitinib 60 mg/kg or combination of both versus vehicle. Data are represented as mean +/− SEM.
(E) Representative images of liver, spleen and bone marrow histology (H&E) are shown after 3 weeks of treatment in C220 at 10 mg/kg, ruxolitinib 60 mg/kg or combination of both versus vehicle treated mice. Magnification 1000X, 200X and 40X. Black arrows point to megakaryocytes. Red arrows point to myeloid infiltrate. Red circles surround follicles in spleen.
(F) Absolute number of megakaryocytes per 200 HPF in the bone marrow histology is shown for C220 at 12.5 mg/kg, ruxolitinib 60 mg/kg or combination of both versus vehicle treated mice. Data are represented as mean +/− SEM (***p<0.001, **p<0.01).
(G) Representative images of bone marrow and spleen fibrosis (reticulin stain) are shown after 3 weeks of treatment in C220 at 10 mg/kg, ruxolitinib 60 mg/kg or combination of both versus vehicle treated mice. Magnification 400X.
(H) Histologic grade of reticulin fibrosis in the bone marrow in the 4 treatment arms is illustrated. For each sample, degree of fibrosis was evaluated in 6 HPF (0=no fibrosis, 1=focal mild fibrosis, 2=marked, but non-diffuse fibrosis, 3=diffuse fibrosis). Each data point reflects the mean value of fibrosis for each mouse (3 mice per group). Data are illustrated as means +/− SEM (**p<0.01, *p<0.05).
(I) Histologic grade of reticulin fibrosis in the spleen in the 4 treatment arms is illustrated. For each sample, degree of fibrosis was evaluated in 6 HPF (0=no fibrosis, 1=focal mild fibrosis, 2=marked, but non-diffuse fibrosis, 3=diffuse fibrosis). Each data point reflects the mean value of fibrosis for each mouse (3 mice per group). Data are illustrated as means +/− SEM (**p<0.01).
(J) Serum cytokine levels measured after 3 weeks of treatment with C220 at 10 mg/kg, ruxolitinib at 60 mg/kg or combination of both versus vehicle treated mice are illustrated as individual points indicating fold change relative to vehicle. Only cytokines significantly attenuated by the combo versus vehicle group are shown. Data are illustrated as means +/− SEM (***p<0.001**p<0.01, *p<0.05).
