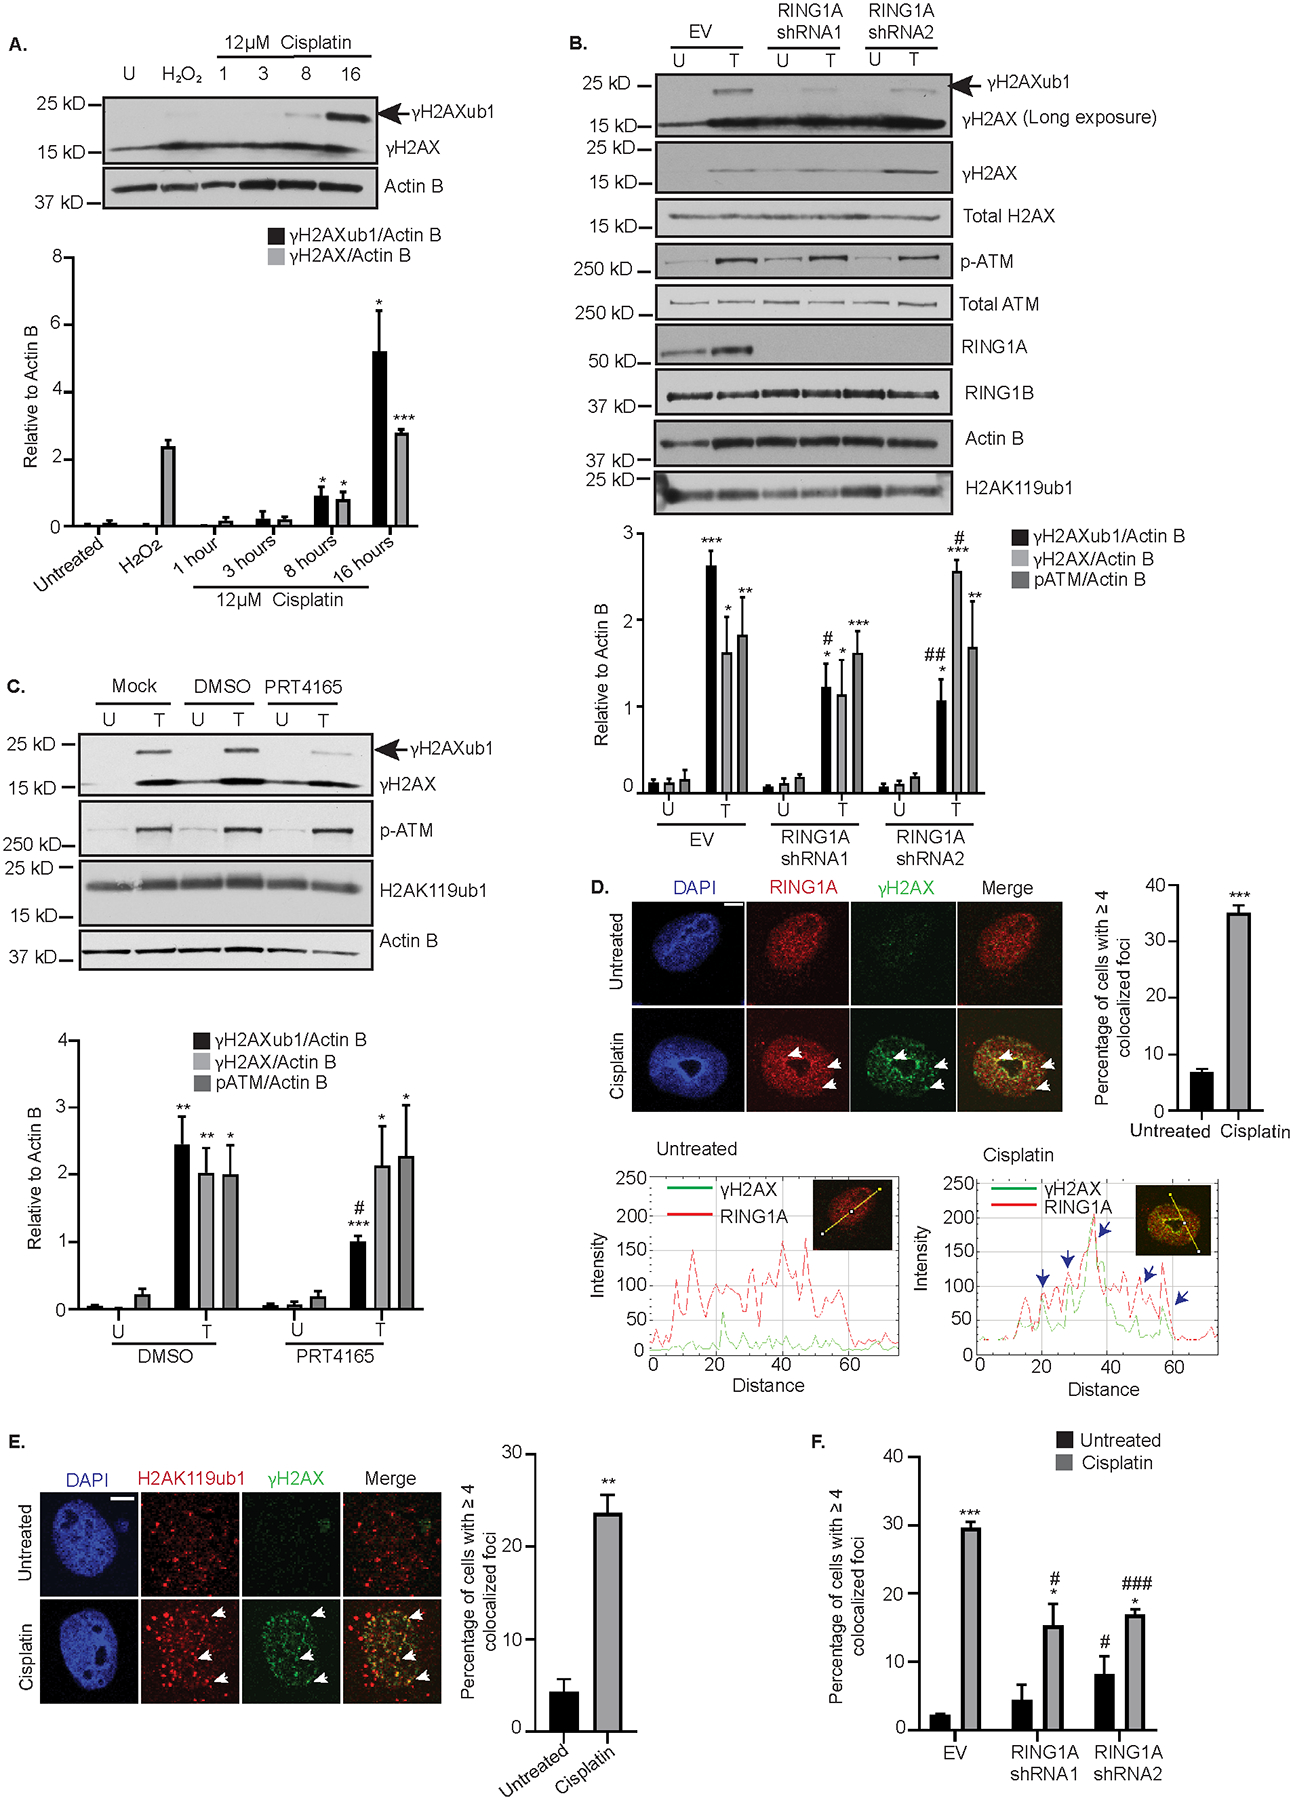
Figure 1: RING1A mediates platinum-induced monoubiquitination of γH2AX.

(A) OVCAR5 cells were untreated (U) or treated with 12 μM cisplatin (IC50 dose) for 1, 3, 8 and 16 hours or with 2 mM H2O2 for 30 mins (used as a negative control). Cell lysates were analyzed by western blot. Graph depicts mean ± SEM of densitometric analysis of indicated proteins relative to Actin B at the indicated time points (N=3). (B) OVCAR5 cells infected with empty vector (EV) or 2 different RING1A shRNAs were untreated (U) or treated (T) with 12 μM cisplatin for 8 hours. Data is presented as in (A). (C) OVCAR5 cells were either untreated (U) or treated with 12 μM cisplatin (T) alone or in combination with DMSO or 10 μM PRT4165 for 8 hours. Data is presented as in (A). (D) OVCAR5 cells were treated 12 μM cisplatin for 8 hours. Immunofluorescence analysis was performed for RING1A (red) and the damage marker γH2AX (green). Merge image shows overlap of γH2AX and RING1A. White arrows indicate examples of RING1A foci that colocalize with γH2AX. Graph displays mean percentage of cells with ≥ 4 γH2AX and RING1A colocalized foci ± SEM (N=3). Scale bar = 5 μm. A representative RGB profile of untreated and cisplatin treated cell showing RING1A colocalization with γH2AX. Blue arrows point to foci which colocalize. (E) OVCAR5 cells were treated as in (D). Immunofluorescence analysis was performed for H2AK119ub1 (Red) and γH2AX (green). Merge image shows overlap of H2AK119ub1 and γH2AX. White arrows indicate examples of H2AK119 foci that colocalize with γH2AX. Graph displays mean percentage of cells with ≥ 4 γH2AX and H2AK119ub1 colocalized foci ± SEM (N=3). Scale bar = 5 μm. (F) OVCAR5 cells infected with empty vector (EV) or 2 different RING1A shRNAs were untreated or treated with 12 μM cisplatin for 8 hours and immunofluorescence was performed as in (E). Graph displays mean percentage of cells with ≥ 4 γH2AX and H2AK119ub1 colocalized foci ± SEM (N=3). Statistical significance was calculated using Student’s t-test. For all U versus T, P-values * < 0.05, ** <0.005, *** < 0.0005. For all EV versus RING1A KD or DMSO versus PRT4165, P- values, # < 0.05, ## < 0.005, ### < 0.0005.
