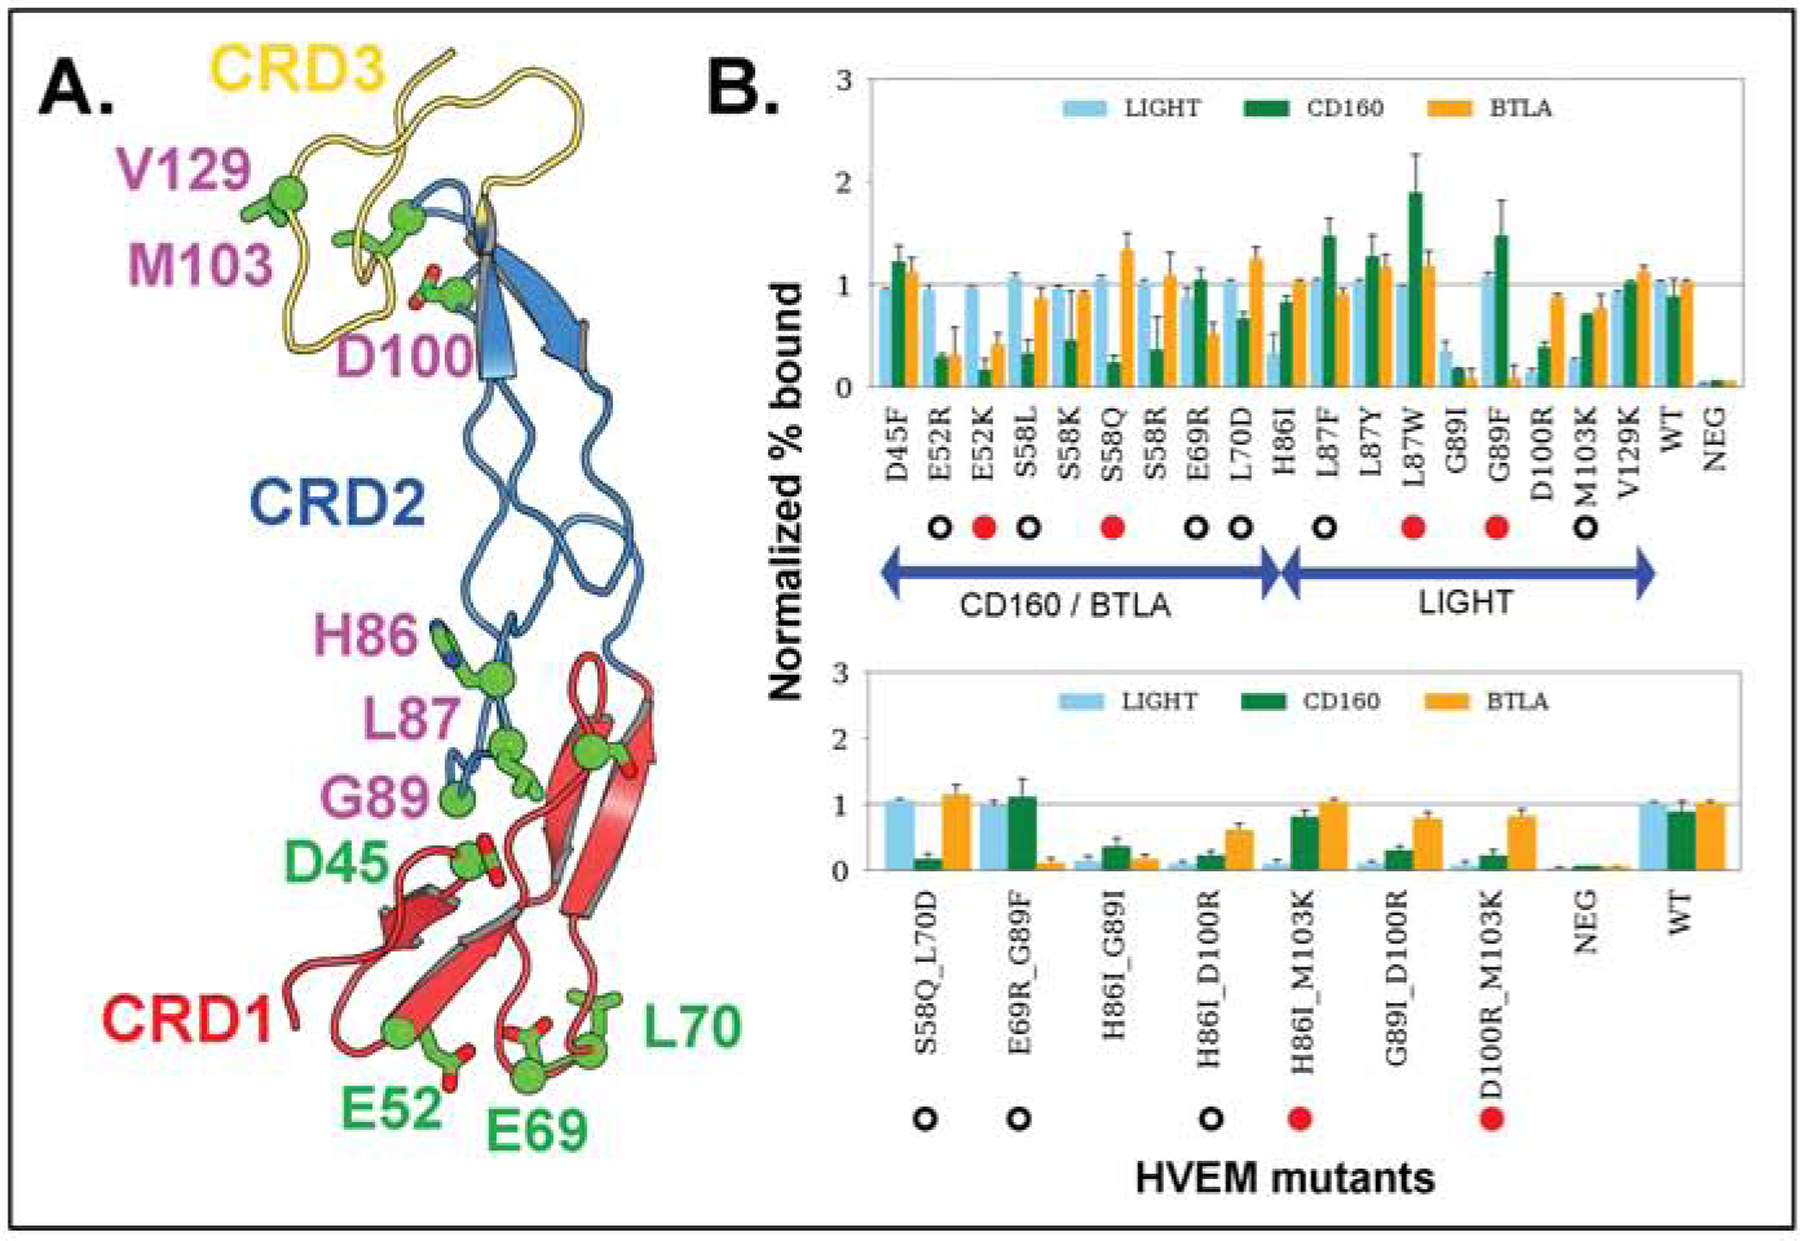
Figure 2.

Engineered positions in HVEM and their binding affinity. (A) Cartoon representation of HVEM domains - CRD1 (red), CRD2 (blue), and CRD3 (yellow). Targeted residue positions are in stick and ball model and highlighted in colors. Residues with green color represent the mutational sites for BTLA or CD160 and magenta color shows residues binding with LIGHT. (B) Experimentally observed Normalized % Bound measures for three ligands - LIGHT, CD160, and BTLA. Single and double point mutations are in the upper and lower panels, respectively. Mutations represented by red circles are the most effective for switching the binding specificities according to their p-values obtained from Welch’s t-test (Suppl. Table 5). Other mutations with statistically significant modulation of binding selectivity are marked with hollow circles.
