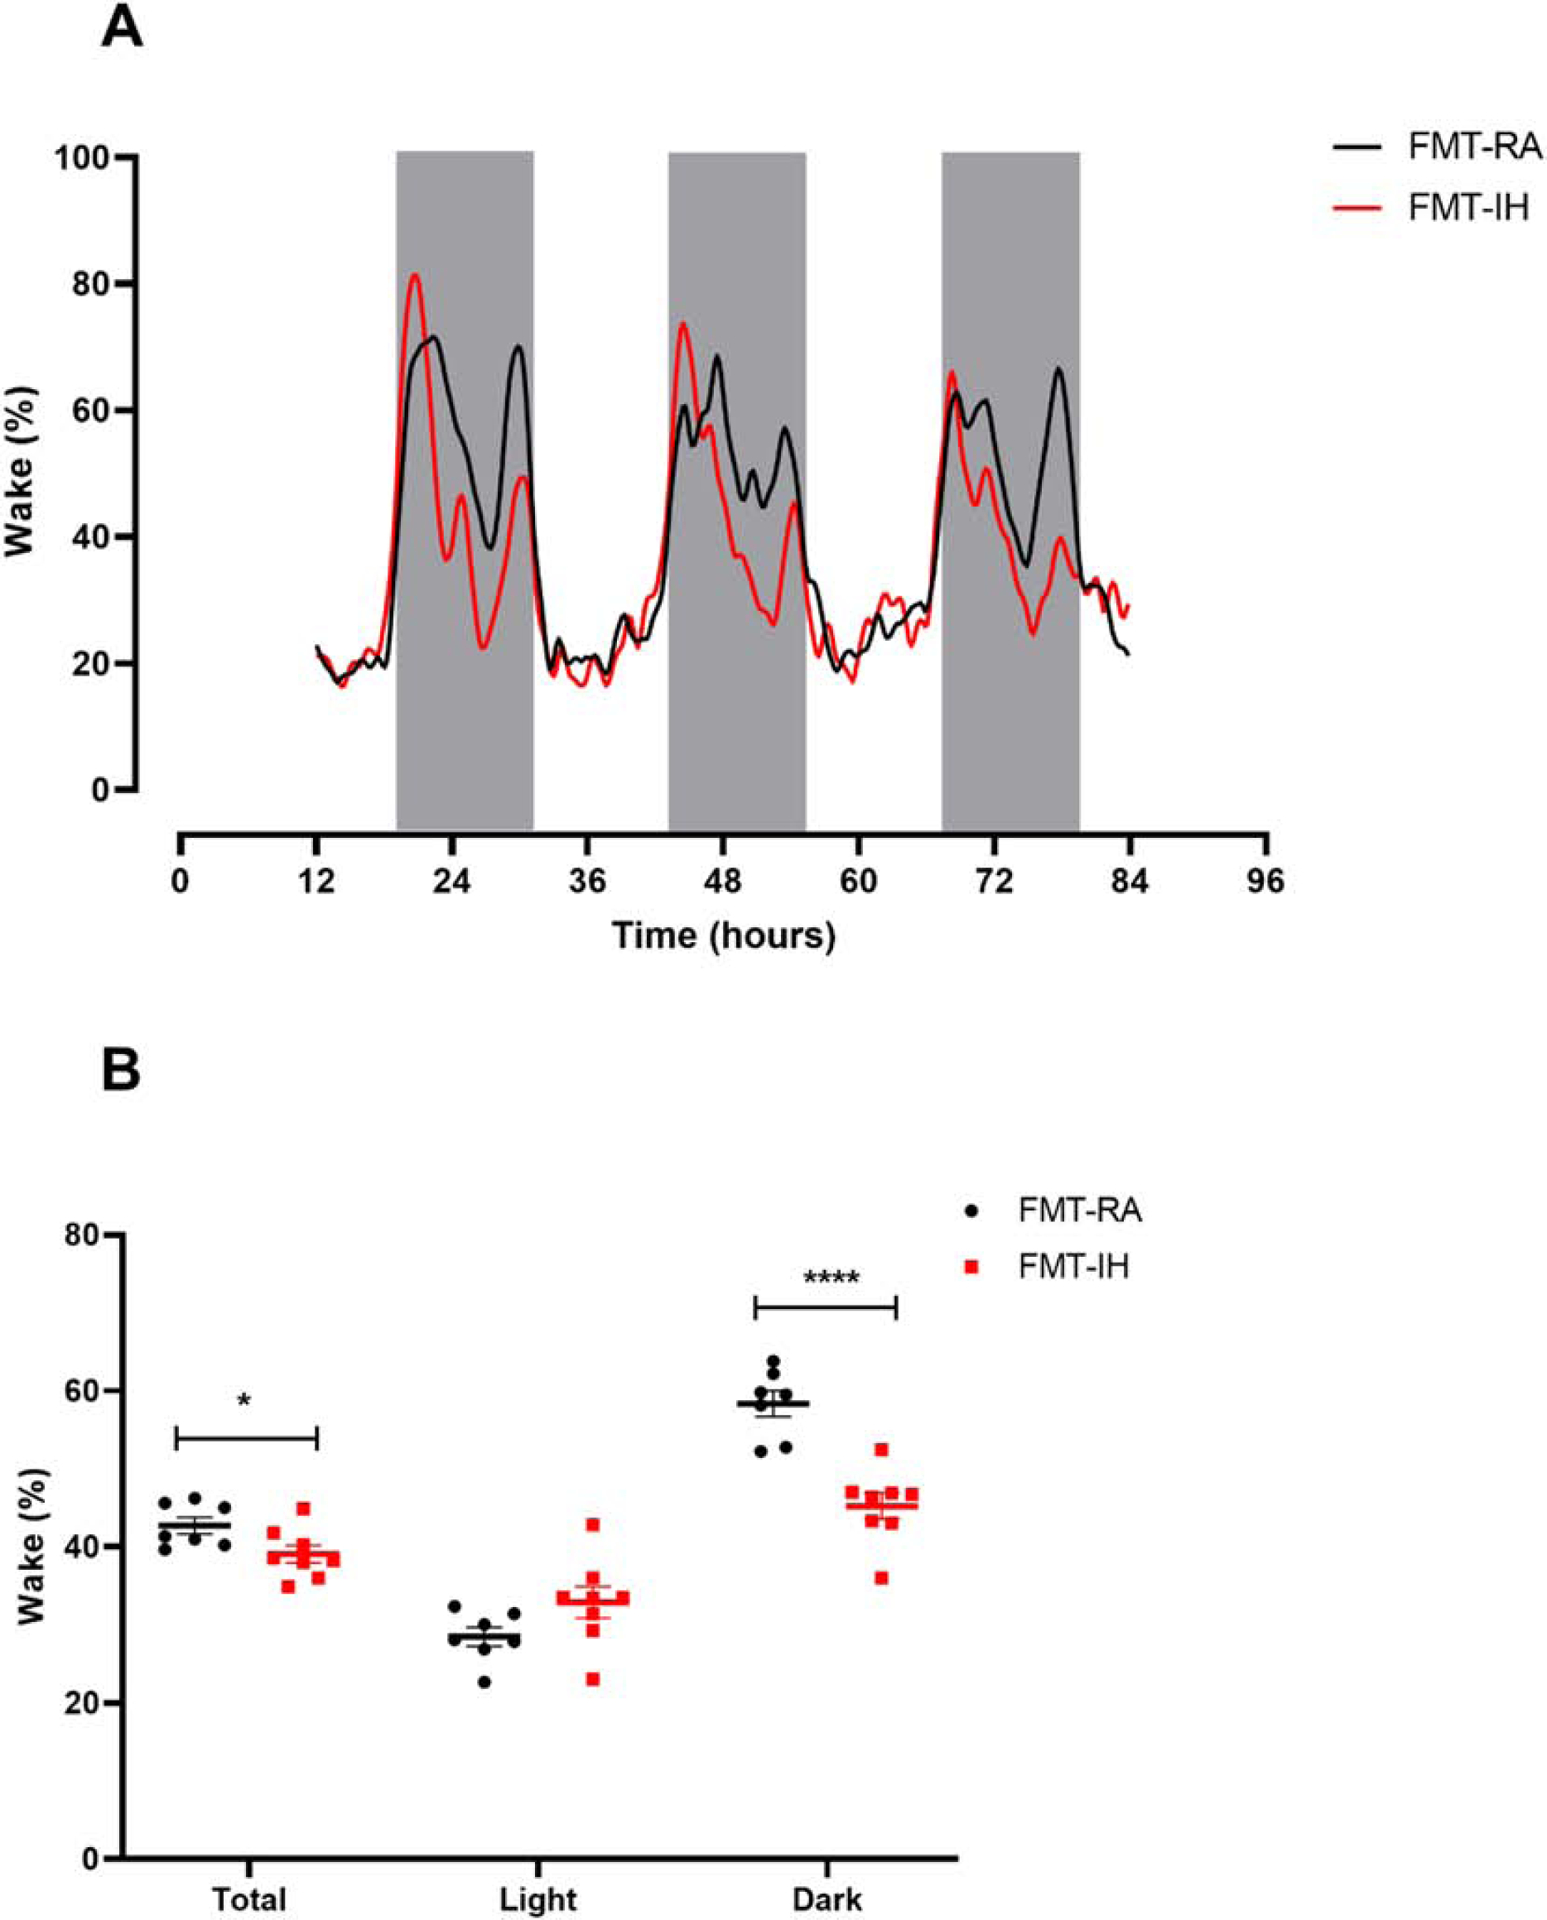
Figure 2:

Changes in sleep patterns between FMT-IH and FMT-RA. A) Representative sleep-wake profiles of FMT-IH and FMT-IA groups over 3 days. B) Quantification of total, light-phase and dark-phase average wake percentages. Groups were compared using Student’s t test (n=7–8). *p < 0.05, ** p < 0.01, ***p < 0.001, ****p < 0.0001.
