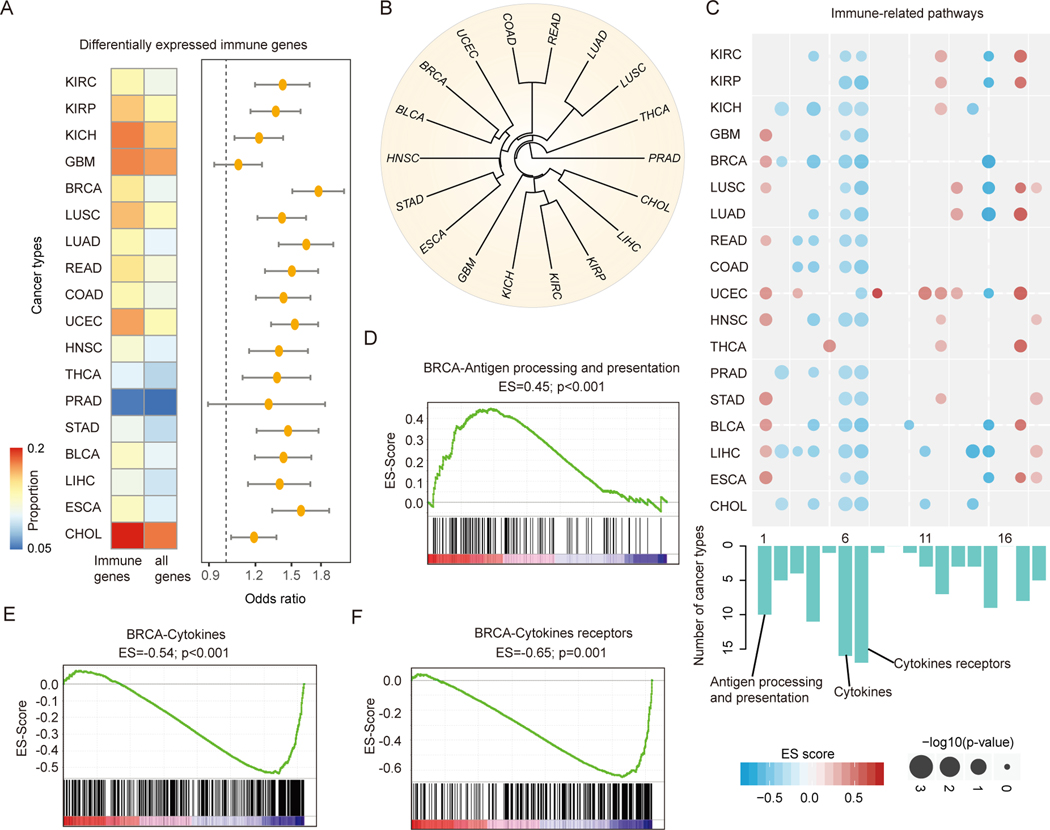
Figure-3. Widespread transcriptome alterations of human immunome in cancer.
(A) The proportion of differentially expressed immunogically relevant genes and all human genes. The odds ratios and 95% confidence levels of Fisher’s exact tests are shown in the right panel. All p-values are less than 0.05 for 18 cancer types with at least fiver normal samples. (B) Cluster of cancer types based on the similarity (Jaccard index) of differentially expressed immune genes. Cancer types of similar tissue origins are clustered together. (C) Heat map shows the p-values and enrichment scores for the differentially expressed genes enriched in immune-related pathways. Each row represents a cancer type and each column represents an immune-related pathway. The sizes of dots show the -log (p-values) and the colors of dots show enrichment scores. The bar plots below the heat map show the number of cancer types enriched for each pathway. (D) - (F) Gene Set Enrichment Analysis shows enrichment or depletion of cytokines, cytokines receptors and activated antigen processing and presentation in breast cancer. The horizontal bar in graded color from red to blue represents the rank-ordered, non-redundant list of all genes. The vertical black lines represent the projection of immune genes in each pathway onto the ranked gene list. (D) for antigen processing and presentation pathway, (E) for cytokines pathway and (F) for pathway cytokines receptors in breast cancer.

