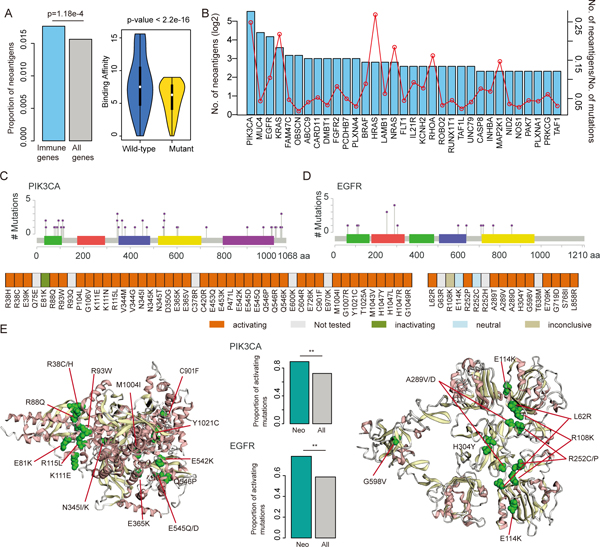
Figure-5. Neoantigen enriched in immunologically relevant genes.
(A) The left panel shows the proportion of neoantigens in immune gene compared to all coding genes (p=1.18e-4, Fisher’s exact test). The right panel shows the distribution of binding affinity of HLAs in wild-type and mutated peptides (p<2.2e-16, Wilcox’s rank sum test). (B) Number of neoantigens in immune-related genes. The barplots show the number of neoantigens generated from each immune-related gene. The red dot line shows the number of neoantigens/number of total mutations in each gene. (C) Distribution of the mutations in PIK3CA that generate neoantigens. (D) Distribution of the mutations in EGFR that generate neoantigens. (E) The left and right panels show the 3D structure of PIK3CA and EGFR, red dots represent the mutations in the same cluster. The middle panels show the proportion of functional mutations, the green bars for mutations encoding neoantigens and grey bars for all screened mutations. **p<0.05 for Fisher’s exact test.

