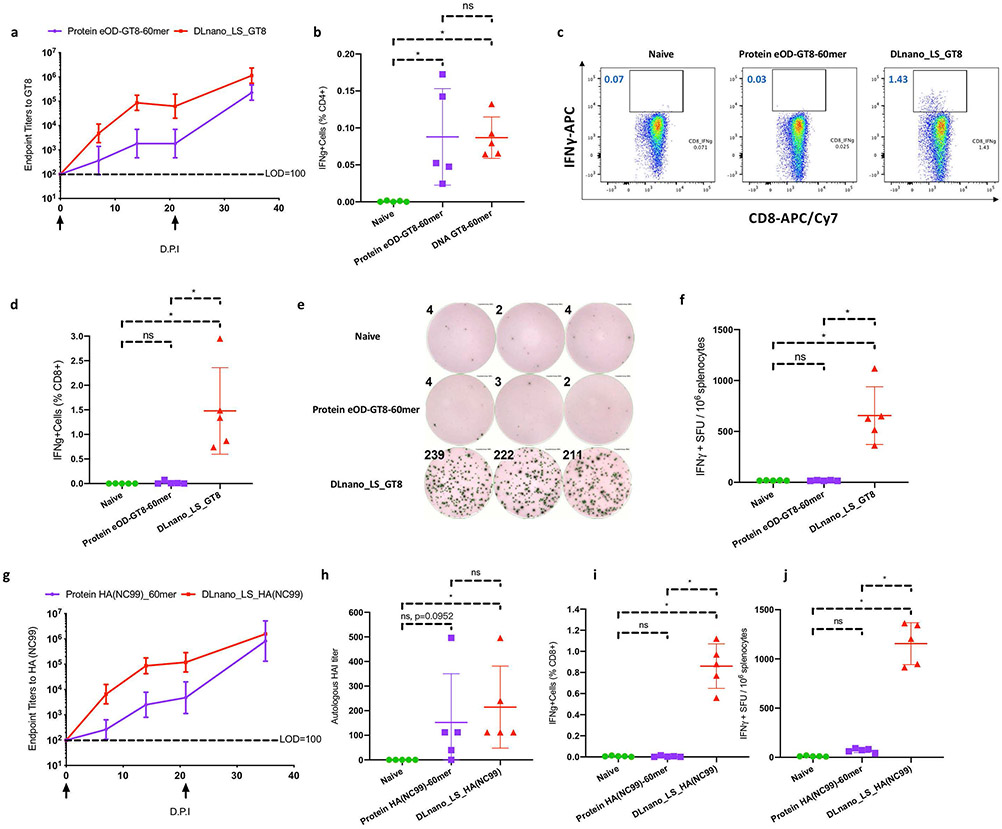
Figure 1. Comparison of immune responses induced by DLnano_LS_GT8 and protein eOD-GT8-60mer, as well as DLnano_LS_HA(NC99) versus HA(NC99)-60mer in BALB/c mice.
Mice received either 25 μg DNA vaccination with EP or 10 μg RIBI-adjuvanted protein vaccination without EP twice, three weeks apart, and were euthanized two weeks post second vaccination for cellular analysis. (A) Endpoint titers to GT8-monomer induced by DLnano_LS_GT8 compared to RIBI-adjuvanted protein eOD-GT8-60mer at 0, 7, 14, 21, and 35 d.p.i. LOD: Limit of Detection. (B) CD4+ IFNγ responses to the LS domain induced by DLnano_LS_GT8, protein eOD-GT8-60mer, or in naïve mice 35 d.p.i. (C) Flow cytometry plots and (D) combined statistics for CD8+ IFNγ responses to the GT8 domain induced by DLnano_LS_GT8, protein eOD-GT8-60mer, or in naïve mice at 35 d.p.i. (E) IFNγ ELISpot images with numbers indicating spot counts and (F) combined statistics for overall splenic T-cell responses to the GT8 domain induced by DLnano_LS_GT8, protein eOD-GT8-60mer or in naïve mice at 35 d.p.i. SFU: spot-forming units. (G) Endpoint titers to NC99 hemagglutinin induced by DLnano_LS_HA(NC99) compared to RIBI-adjuvanted protein HA(NC99)-60mer at 0, 7, 14, 21, and 35 d.p.i. (H) HAI titers against autologous H1 A/NewCaledonia/20/1999 induced by DLnano_LS_HA(NC99), protein HA(NC99)-60mer, or in naïve mice at 35 d.p.i. (I) ICS determination of CD8+ T-cell IFNγ responses to the HA domain induced by DLnano_LS_HA(NC99), protein HA(NC99)-60mer, or in naïve mice at 35 d.p.i. (J) IFNγ ELISpot assays for overall splenic T-cell responses to the HA domain induced by DLnano_LS_HA(NC99), protein HA(NC99)-60mer or in naïve mice at 35 d.p.i. Two independent experiments performed for each panel with similar observations made; N=5 mice/group; each dot represents an animal. Error bar represents standard deviation. Arrow below the plot (A,G) represents an immunization. Two-tailed Mann-Whitney Rank test used to compare groups; p-values were adjusted for multiple comparison for (B), (D), (F), (H), (I), and (J); *p-value<0.05; ns: not significant.

