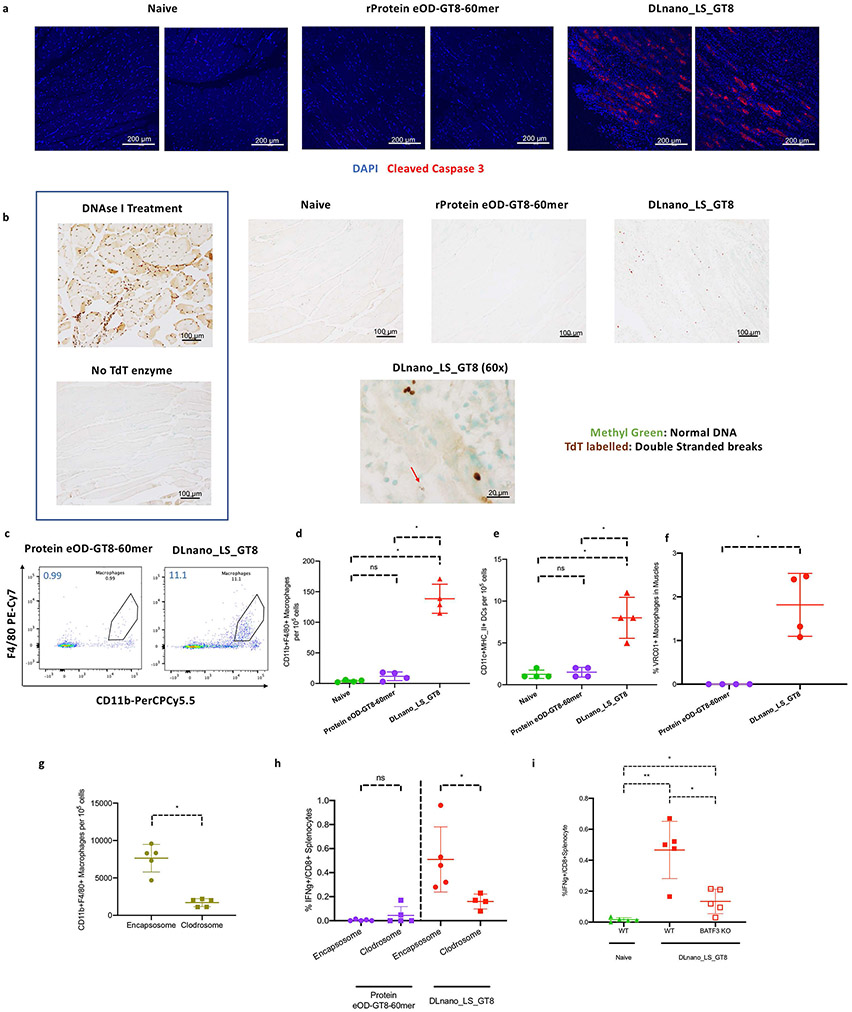
Figure 2. Determination of the role of tissue apoptosis and APC infiltration upon DNA vaccination in C57BL/6 mice.
(A) Immunofluorescence staining for cleaved caspase-3 (red) or nuclei (blue) in muscle sections from naïve mice or those treated with protein eOD_GT8-60mer without EP or DLnano_LS_GT8 with EP harvested 4 d.p.i. (B) TUNEL assay to determine presence of double-stranded DNA breaks (brown) or intact DNA (green) in muscle sections from naïve mice or those treated with protein eOD_GT8-60mer without EP or DLnano_LS_GT8 with EP harvested 4 d.p.i. Red arrow in the 60x image points to an apoptotic neucleus. (C) Flow cytometry plots and (D) combined statistics for the frequency of muscle-infiltrating CD11b+F4/80+ macrophages in naïve mice or those treated with protein eOD-GT8-60mer or DLnano_LS_GT8 7 d.p.i. (E) Flow determination of muscle-infiltrating CD11c+MHCII+ DCs in naïve mice or those treated with protein eOD-GT8-60mer or DLnano_LS_GT8 7 d.p.i. (F) Flow determination for GT8-uptake by VRC01-FITC staining for muscle macrophages in naïve mice or mice treated with protein eOD-GT8-60mer or DLnano_LS_GT8 7 d.p.i. (G) Comparison of changes in frequencies of muscle-infiltrating macrophages 4 d.p.i in mice treated with DLnano_LS_GT8. Mice also received three doses of IV clodrosome or control encapsosome on Days −3, 0 and 3 relative to DNA vaccination. (H) CD8+ T-cell responses induced by DLnano_LS_GT8 or protein eOD-GT8-60mer in mice that did or did not receive systematic macrophage depletion with clodrosome. Mice received 25 μg DNA vaccination with EP or 10 μg RIBI-adjuvanted protein vaccination without EP, and were euthanized two weeks post-vaccination for splenic IFNγ+CD8+ T cells. (I) CD8+ T-cell responses in naïve mice or in C57BL/6 or BATF3KO mice vaccinated with DLnano_LS_GT8. Mice were vaccinated and euthanized with the same dose and schedule as described in (H). One independent experiment was performed for each panel in the figure. N=4 mice/group (C-F) or N=5 mice/group (G-I); each dot represents an animal. Error bar represents standard deviation. Two-tailed Mann-Whitney Rank test used to compare groups; p-values were adjusted for multiple comparison for panels (D), (E), and (I); *p-value<0.05; **p-value<0.005; ns: not significant.

