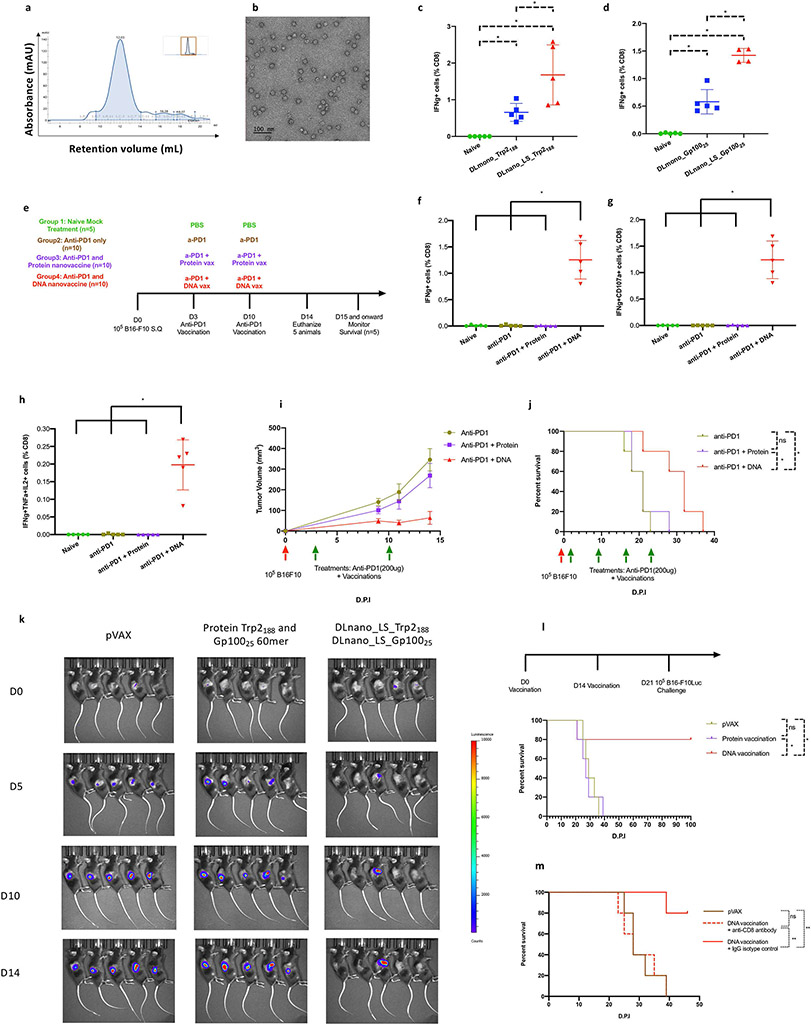
Figure 3. Characterization of the functional importance of CD8+ T-cell priming by DNA-launched versus protein nanoparticle vaccination in a melanoma model in C57BL/6 mice.
(A) SEC trace for the designed LS_Trp2188-60mer. (B) nsEM image of SEC purified LS_Trp2188-60mer nanoparticles. (C-D) Comparison of immunogenicity of DLnano-vaccines versus monomeric DNA vaccines. Mice were vaccinated twice with 10 μg of each DNA vaccine, two weeks apart, and euthanized two weeks post second vaccination for cellular analysis. (C) Comparison of CD8+ IFNγ T-cell responses to Trp2188 peptide in the spleens of naïve or immunized mice. (D) Comparison of CD8+ IFNγ T-cell responses to Gp10025 peptide in the spleens of naïve or immunized mice. (E) Treatment and vaccination schemes used to study CD8+ T-cell responses to both Trp2188 and Gp10025 peptides in naïve mice and B16F10 tumor-bearing mice that received anti–PD-1 treatment alone or in combination with protein (4 μg) or DNA vaccination (10 μg) of LS-GT8–scaffolded 60mer nanoparticles presenting Trp2188 and Gp10025 epitopes. (F-H) Induced IFNγ+, IFNγ+CD107a+, or IFNγ+TNFα+IL2+ CD8+ T-cell responses to Trp2188 in the spleens of naïve tumor-free mice or B16-F10–bearing mice that received treatments as described in (E). (I) Tumor growth and (J) overall survival in mice challenged with 105 B16-F10 cells and then received treatments as described in (E). (K) IVIS imaging to determine in vivo tumor growth in the prophylactic tumor model where mice first received two vaccinations of pVAX vector, combination of protein Trp2188 and Gp10025-60mer, or combination of DLnano_LS_Trp2188 and DLnano_LS_Gp10025 and were then challenged with 105 B16-F10-Luc cells seven days post second immunization. (L) Survival curves for mice shown in (K). (M) Survival curves for mice that first received two vaccinations, two weeks apart, of pVAX vector or combination of DLnano_LS_Trp2188 and DLnano_LS_Gp10025. The mice were then given either anti- CD8 or rat IgG2b isotype control and one day later challenged with 105 B16-F10-Luc cells at seven days post the second immunization. One independent experiment was performed for each panel. N=5 mice/group; each dot represents a mouse. Green arrows below the plot (I,J) represents treatments. Error bar represents standard deviation. Two-tailed Mann-Whitney Rank test used to compare groups for (C), (D), (F), (G), and (H); log-rank tests were used to compare survivals between two groups for (J), (L) and (M); p-values were adjusted for multiple comparison for (C), (D), (F), (G), (H), (J), (L), and (M); *p-value<0.05; **p-value<0.005; ns: not significant.

