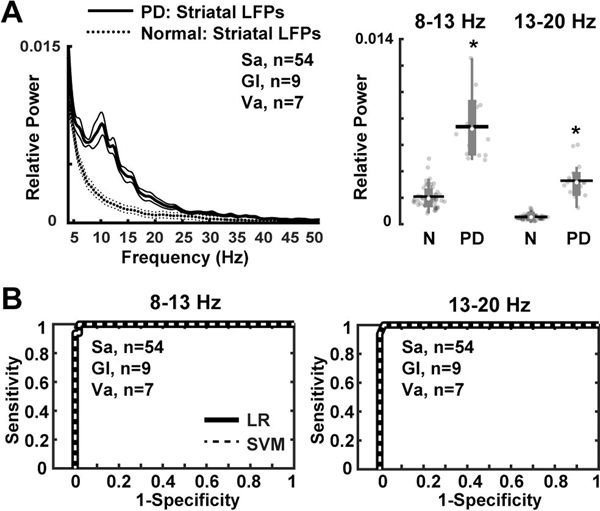
Figure 1. Striatal LFPs in parkinsonian non-human primates (NHPs).
(A) Relative power in the 8–13 Hz and 13–20 Hz frequency bands showing significant increases in the dopamine depleted striatum of NHPs (Gl, n=9; Va, n=7 recordings) as compared with the intact striatum in the normal NHP (Sa, n=54 recordings). (B) Classification of control (Sa, n=54 recordings) versus parkinsonian NHPs (9 Gl and 7 Va, total n=16 recordings) based on power values of 8–13 Hz and 13–20 Hz frequency bands. Receiver operating characteristic plots show the true (sensitivity) vs. false positive rates (1-specificity) of MPTP-treated vs. normal NHPs discrimination for each frequency band separately using logistic regression (LR) and support vector machines (SVM) methods. Thick and thin lines represent mean and standard error of mean, respectively. Significant difference is denoted by *P<0.01. N = Normal NHP; PD = MPTP-treated NHP. The black horizontal lines and white circles in the box plots represent the mean and median values, respectively.

