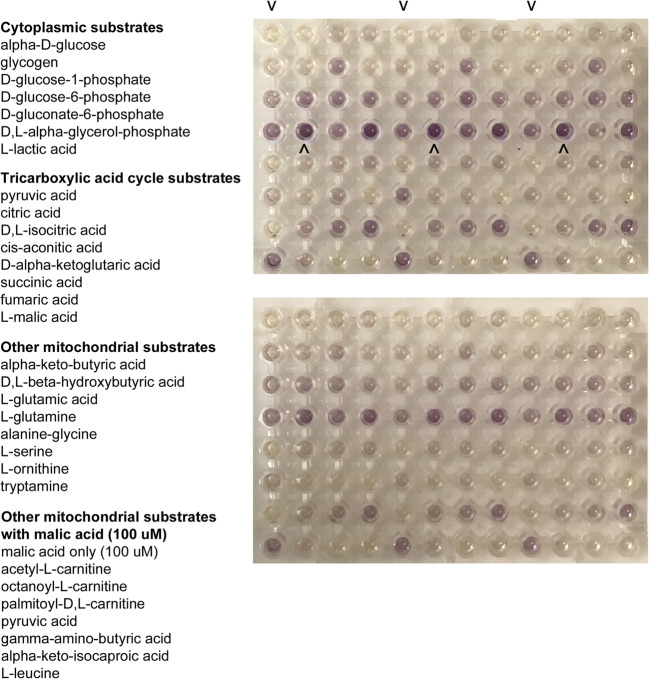
Fig. 2.
Two representative mitochondrial functional assays using Mitoplate S-1 and pooled granulosa cells from individual patients. The assay plates contained the individual 31 cytoplasmic and mitochondrial metabolic substrates as the sole energy source in wells, and wells were repeated in triplicate. The substrates are listed to the left. As the cells metabolized the energy source and produced NADH or FADH2, a tetrazolium dye in the medium was proportionately reduced, generating a purple color. Color development was measured by absorbance using a kinetic assay over 2 h. The top two rows indicate no substrate controls (v) and cytoplasmic substrates. Rows 3, 4 contain mitochondrial substrates, including positive control (^) succinic acid. Rows 5, 6 contain other mitochondrial substrates, and 7,8 contain other mitochondrial substrates in the presence of 100 μM malic acid

