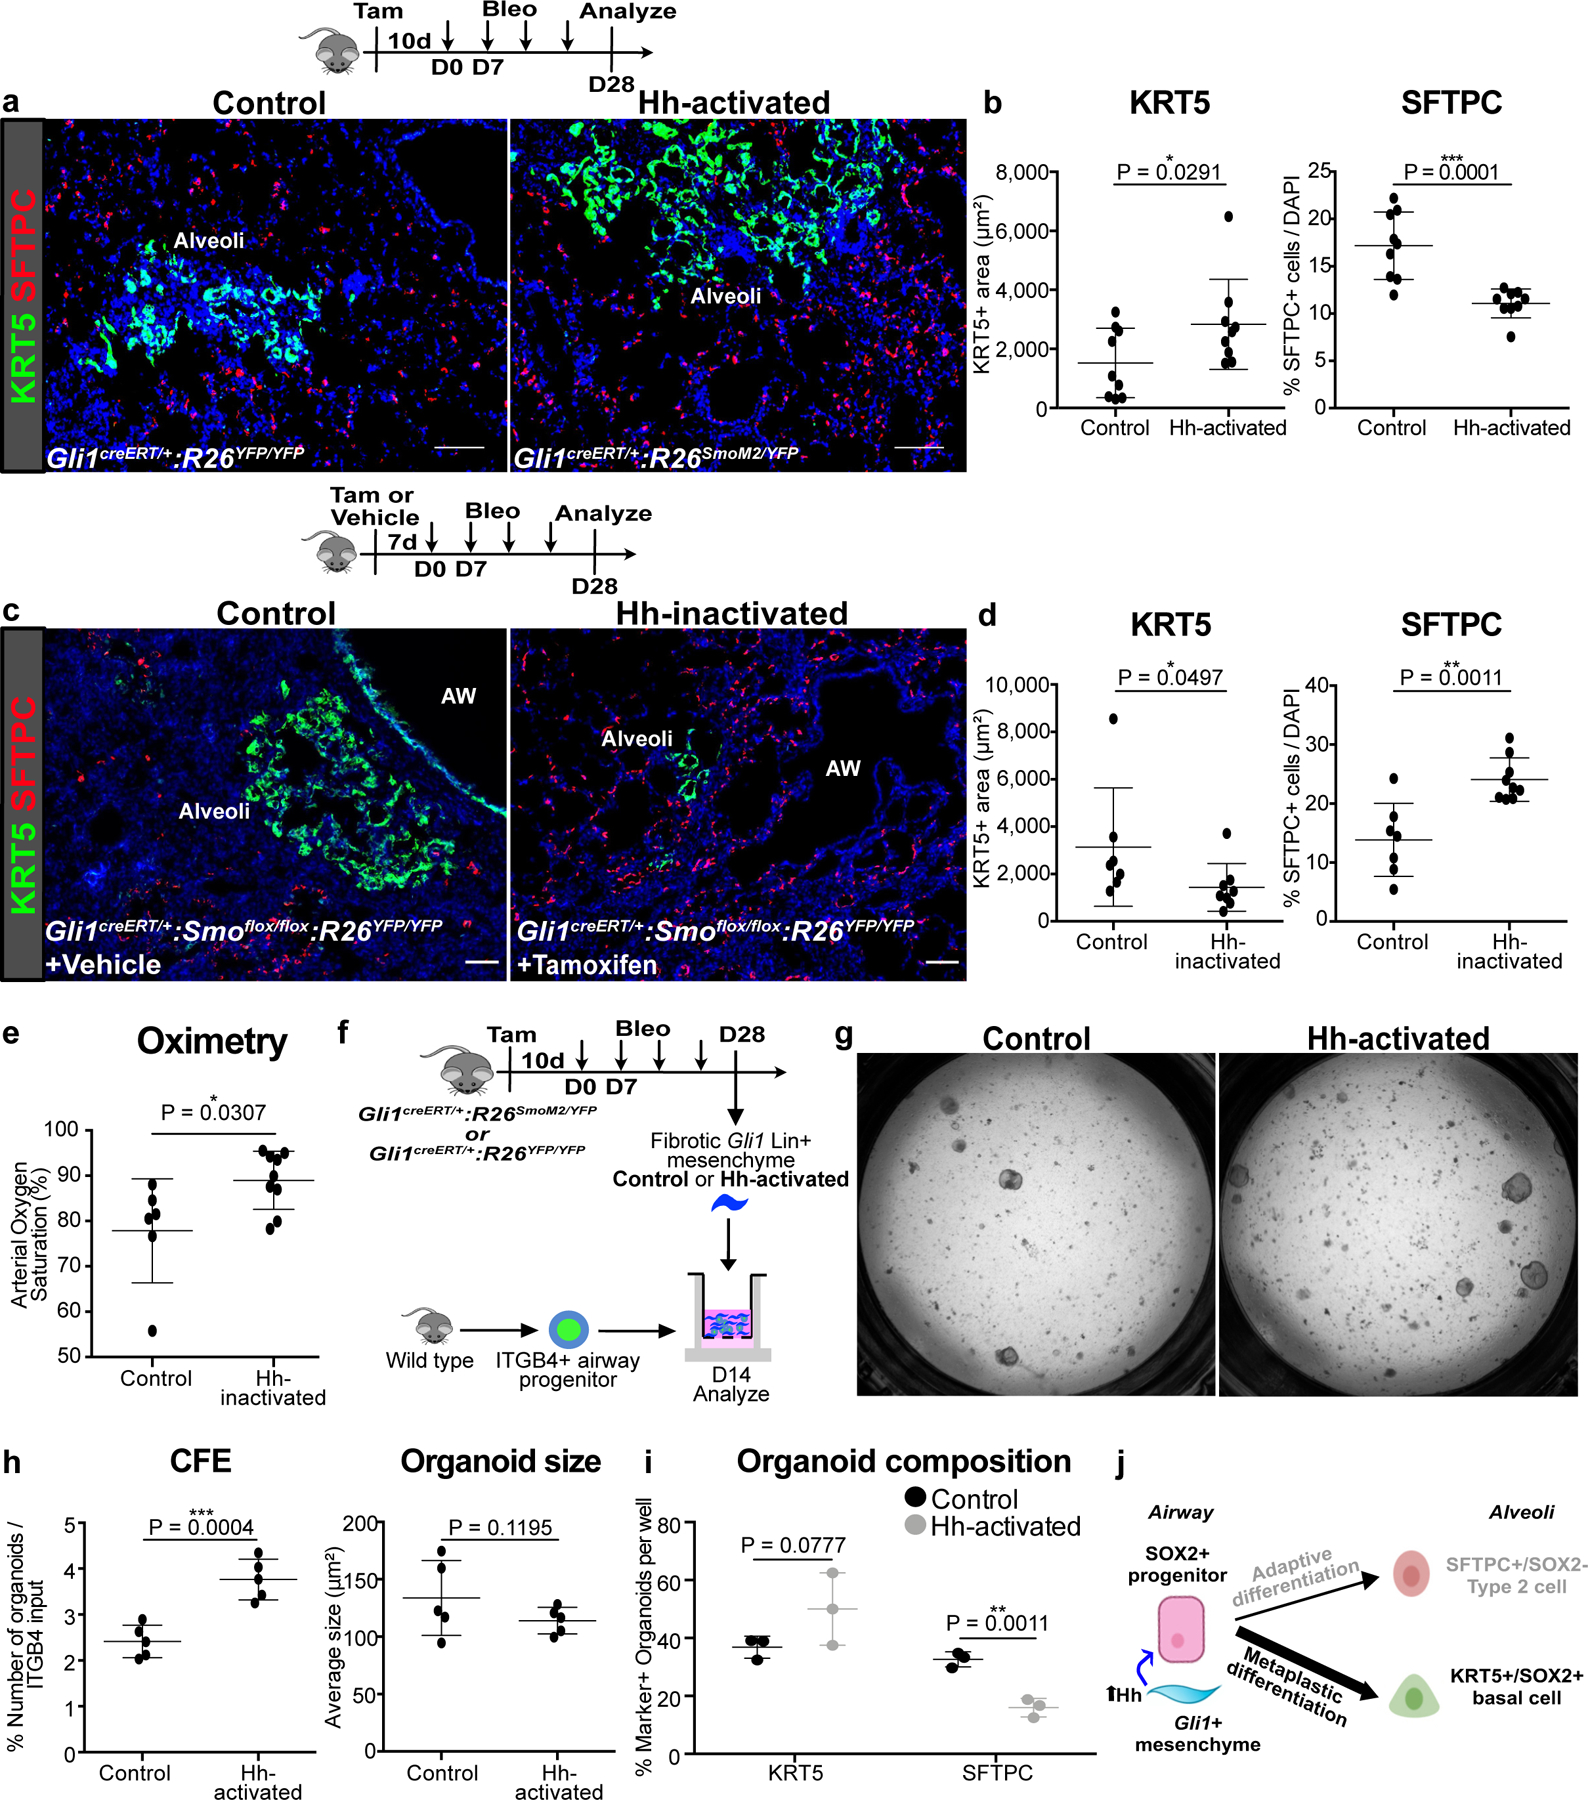
Figure 3. Mesenchymal Hh activation promotes metaplastic KRT5 differentiation while suppressing SFTPC differentiation from airway.

(a,b) Histology quantification of areas of KRT5+ pods and percentage of SFTPC+ cells after constitutive Hh activation (activation with SmoM2) in Gli1+ cells followed by bleomycin injury (n = 9 per group; each data point represents one animal; one-tailed unpaired Student’s t-test). Data are expressed as mean ± SD.
(c-e) Histology quantification of areas of KRT5+ pods and percentage of SFTPC+ cells and oximetry after Hh inactivation (deletion of Smo) in Gli1+ cells followed by bleomycin injury (n = 7 for control, n = 9 for Hh-inactivated; each data point represents one animal; one-tailed unpaired Student’s t-test for (d,e)). Data are expressed as mean ± SD.
(f-i) CFE, organoid size, and composition of airway progenitors co-cultured with Gli1 Lin+ mesenchyme isolated from Hh-activated fibrotic lungs compared to Gli1 Lin+ mesenchyme from control fibrotic lung (n = 5 per group for (h), n = 3 per group for (i); each data point represents one well; one-tailed unpaired Student’s t-test for (h,i)). Data are expressed as mean ± SD.
(j) Model of Hh activation in the Gli1+ mesenchyme acting in trans to promote SOX2+ progenitor differentiation into metaplastic KRT5+ basal cells. Data are expressed as mean ± SD. Hh = hedgehog. Scale bars, 100 µm.
