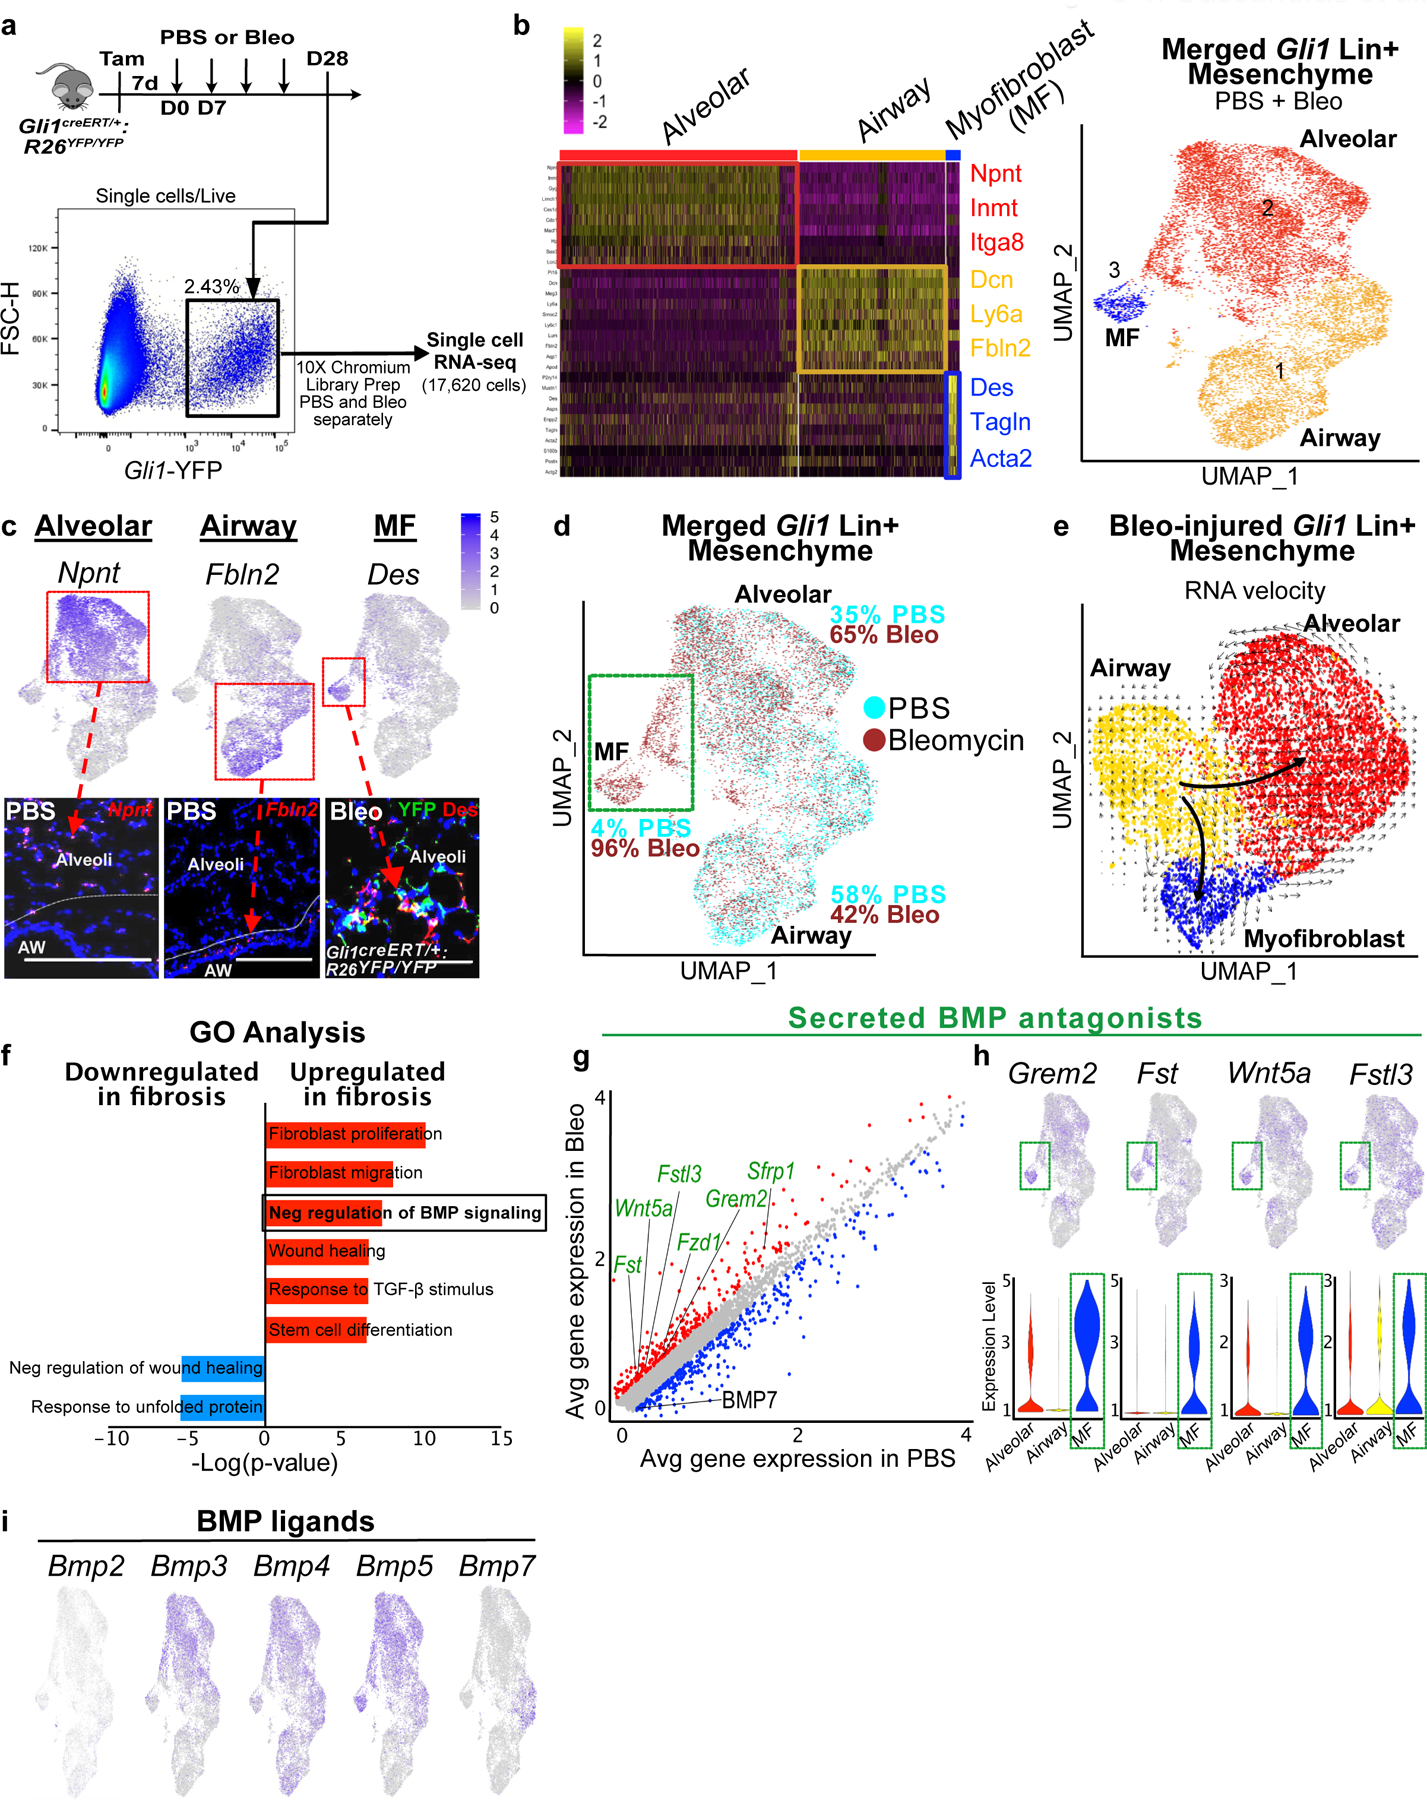
Figure 4. Single cell transcriptome analysis of Gli1 Lin+ mesenchyme reveals upregulated BMP antagonism in the fibrotic niche.

(a) Workflow to isolate Gli1 Lin+ cells during homeostasis (PBS) and fibrosis (bleomycin) for single cell analysis (one animal per treatment).
(b) Left: Heatmap of merged Gli1 Lin+ cells (PBS and bleomycin) segregates into 3 distinct clusters based on transcriptome, with highest expressing cluster-defining genes to the right. Right: UMAP plot of the three distinct clusters that appears segregated based on anatomic location.
(c) in situ (RNAscope) and immunofluorescent analysis shows spatial distribution of signature genes for alveolar, airway, and myofibroblast clusters. This experiment was repeated twice independently with similar results.
(d) UMAP plot with cells of origin based on treatment shows an increase in proportion of cells in the alveolar and myofibroblast cluster after fibrotic injury. Portion of the alveolar cluster and the entire myofibroblast cluster is derived from bleo-injured cells (green box).
(e) RNA velocity analysis predicting the transcriptional trajectory of Gli1 Lin+ cellular clusters.
(f) GO term analysis of differentially-expressed genes between PBS and bleo-treated Gli1 Lin+ cells reveals enrichment for genes involved in negative regulation of BMP signaling during fibrotic repair (P-adj = 2.26E-02; MAST test).
(g) Gene correlation plot with each dot representing a gene, with genes significantly upregulated in fibrotic Gli1 Lin+ cells in red (P-adj. < 0.1, logfc >0.15) and downregulated (P-adj. < 0.1, logfc <−0.15) in blue. Secreted BMP antagonists (GO term: negative regulation of BMP signaling) are labeled in green (Grem2 P-adjusted = 1.32E-21; Fst P-adj = 2.97E-122; Wnt5a P-adj = 2.18E-51; Sfrp1 P-adj = 2.99E-72; Fstl3 P-adj = 1.78E-77; Fzd1 P-adj = 2.36E-69; Bmp7 P-adj = 8.77E-51; MAST test).
(h) Gene feature plots and violin plots of secreted BMP antagonists show enrichment in myofibroblast and part of distal cluster (green box). The violin bodies represent distribution of the cells (n = 11,925 cells).
(i) Gene feature plots of BMP ligand expression in Gli1 Lin+ mesenchyme. MF = myofibroblast, UMAP = Uniform Manifold Approximation and Projection, GO = Gene Ontology, BMP = Bone morphogenetic protein
Scale bars, 100 µm.
