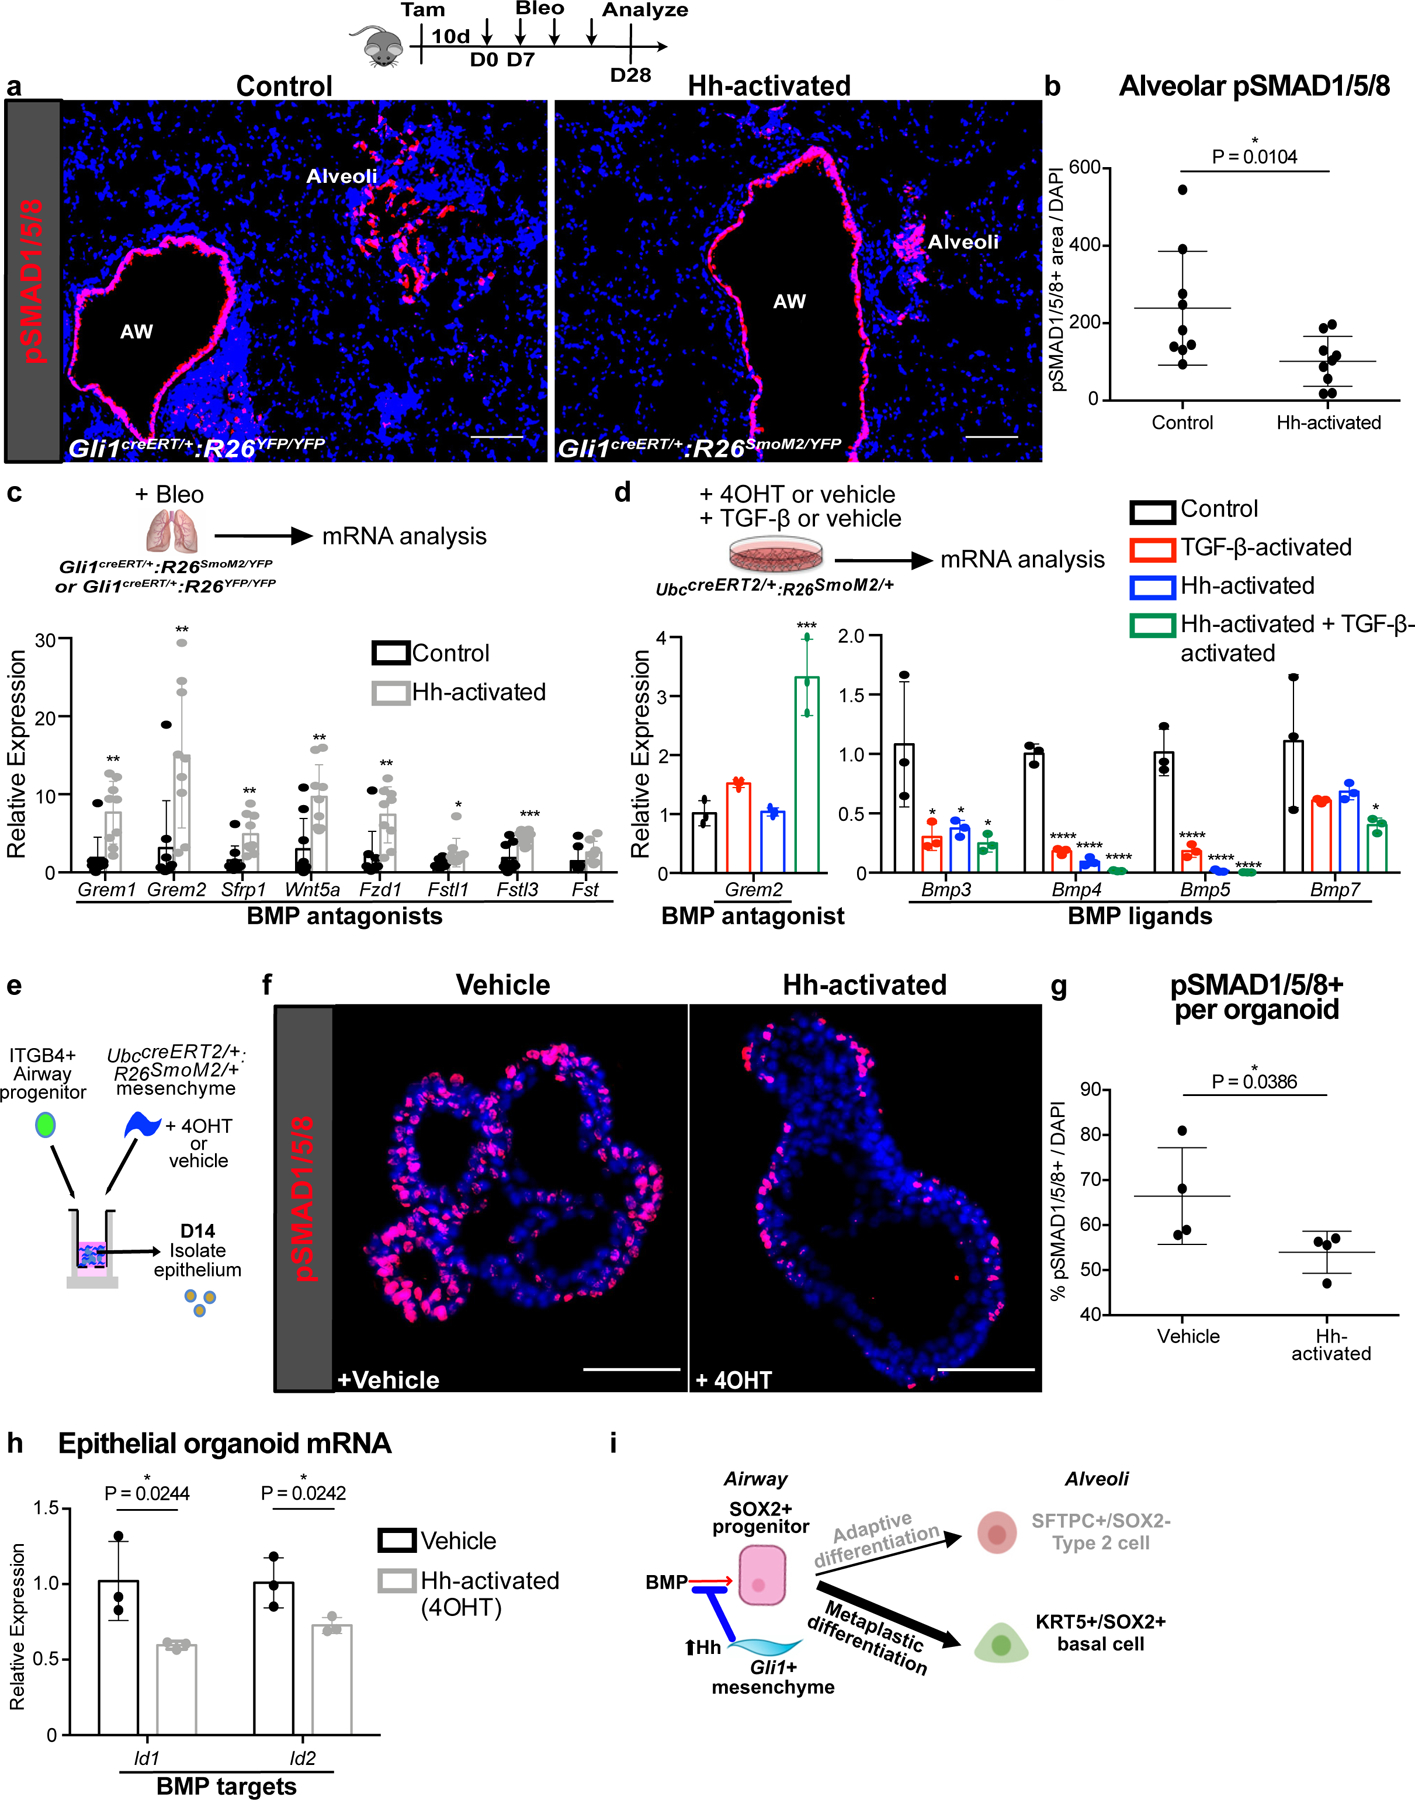
Figure 5. Hh activation upregulates BMP antagonism in the fibrotic lung.

(a,b) Histology quantification of alveolar pSMAD1/5/8 staining in Hh-activated lungs compared to controls in bleomycin treated animals (n = 9 per group; each data point represents one animal; one-tailed unpaired Student’s t-test). Data are expressed as mean ± SD.
(c) Expression of secreted BMP antagonists in Hh-activated lungs compared to controls during fibrotic repair (n = 9 per group; each data point represents one animal; Grem1 P = 0.0011; Grem2 P = 0.0027; Sfrp1 P = 0.0027; Wnt5a P = 0.0014; Fzd1 P = 0.0021; Fstl1 P = 0.0185; Fstl3 P = 0.0008; Fst P = 0.0686; one-tailed unpaired Student’s t-test). Data are expressed as mean ± SD.
(d) qPCR of BMP antagonist Grem2 and various BMP ligands in Hh-inducible cultured mesenchyme with or without TGF-β activation (n = 3; each data point represents one biological replicate). Grem2: Control v TGF-β P = 0.2431, Control v Hh-activated P = 0.9995, Control v TGF-β + Hh-activated P = 0.0001; Bmp3: Control v TGF-β P = 0.0206, Control v Hh-activated P = 0.0330, Control v TGF-β + Hh-activated P = 0.0147; Bmp4: Control v TGF-β P < 0.0001, Control v Hh-activated P < 0.0001, Control v TGF-β + Hh-activated P < 0.0001; Bmp5: Control v TGF-β P < 0.0001, Control v Hh-activated P < 0.0001, Control v TGF-β + Hh-activated P < 0.0001; Bmp7: Control v TGF-β P = 0.1446, Control v Hh-activated P = 0.2303, Control v TGF-β + Hh-activated P = 0.0386; ordinary one-way ANOVA test. Data are expressed as mean ± SD.
(e-g) pSMAD1/5/8+ cell number in progenitor-derived organoids with Hh-activated mesenchyme. (n = 4; each data point represents one well; one-tailed unpaired Student’s t-test). Data are expressed as mean ± SD.
(h) BMP target gene expression in epithelial organoids isolated after co-culture with Hh-inducible mesenchyme (n = 3; each datapoint represents one well; one-tailed unpaired Student’s t-test). Data are expressed as mean ± SD.
(i) Hh upregulation of BMP antagonism in the fibrotic progenitor niche drives metaplastic KRT5 differentiation. Scale bars, 100 µm.
