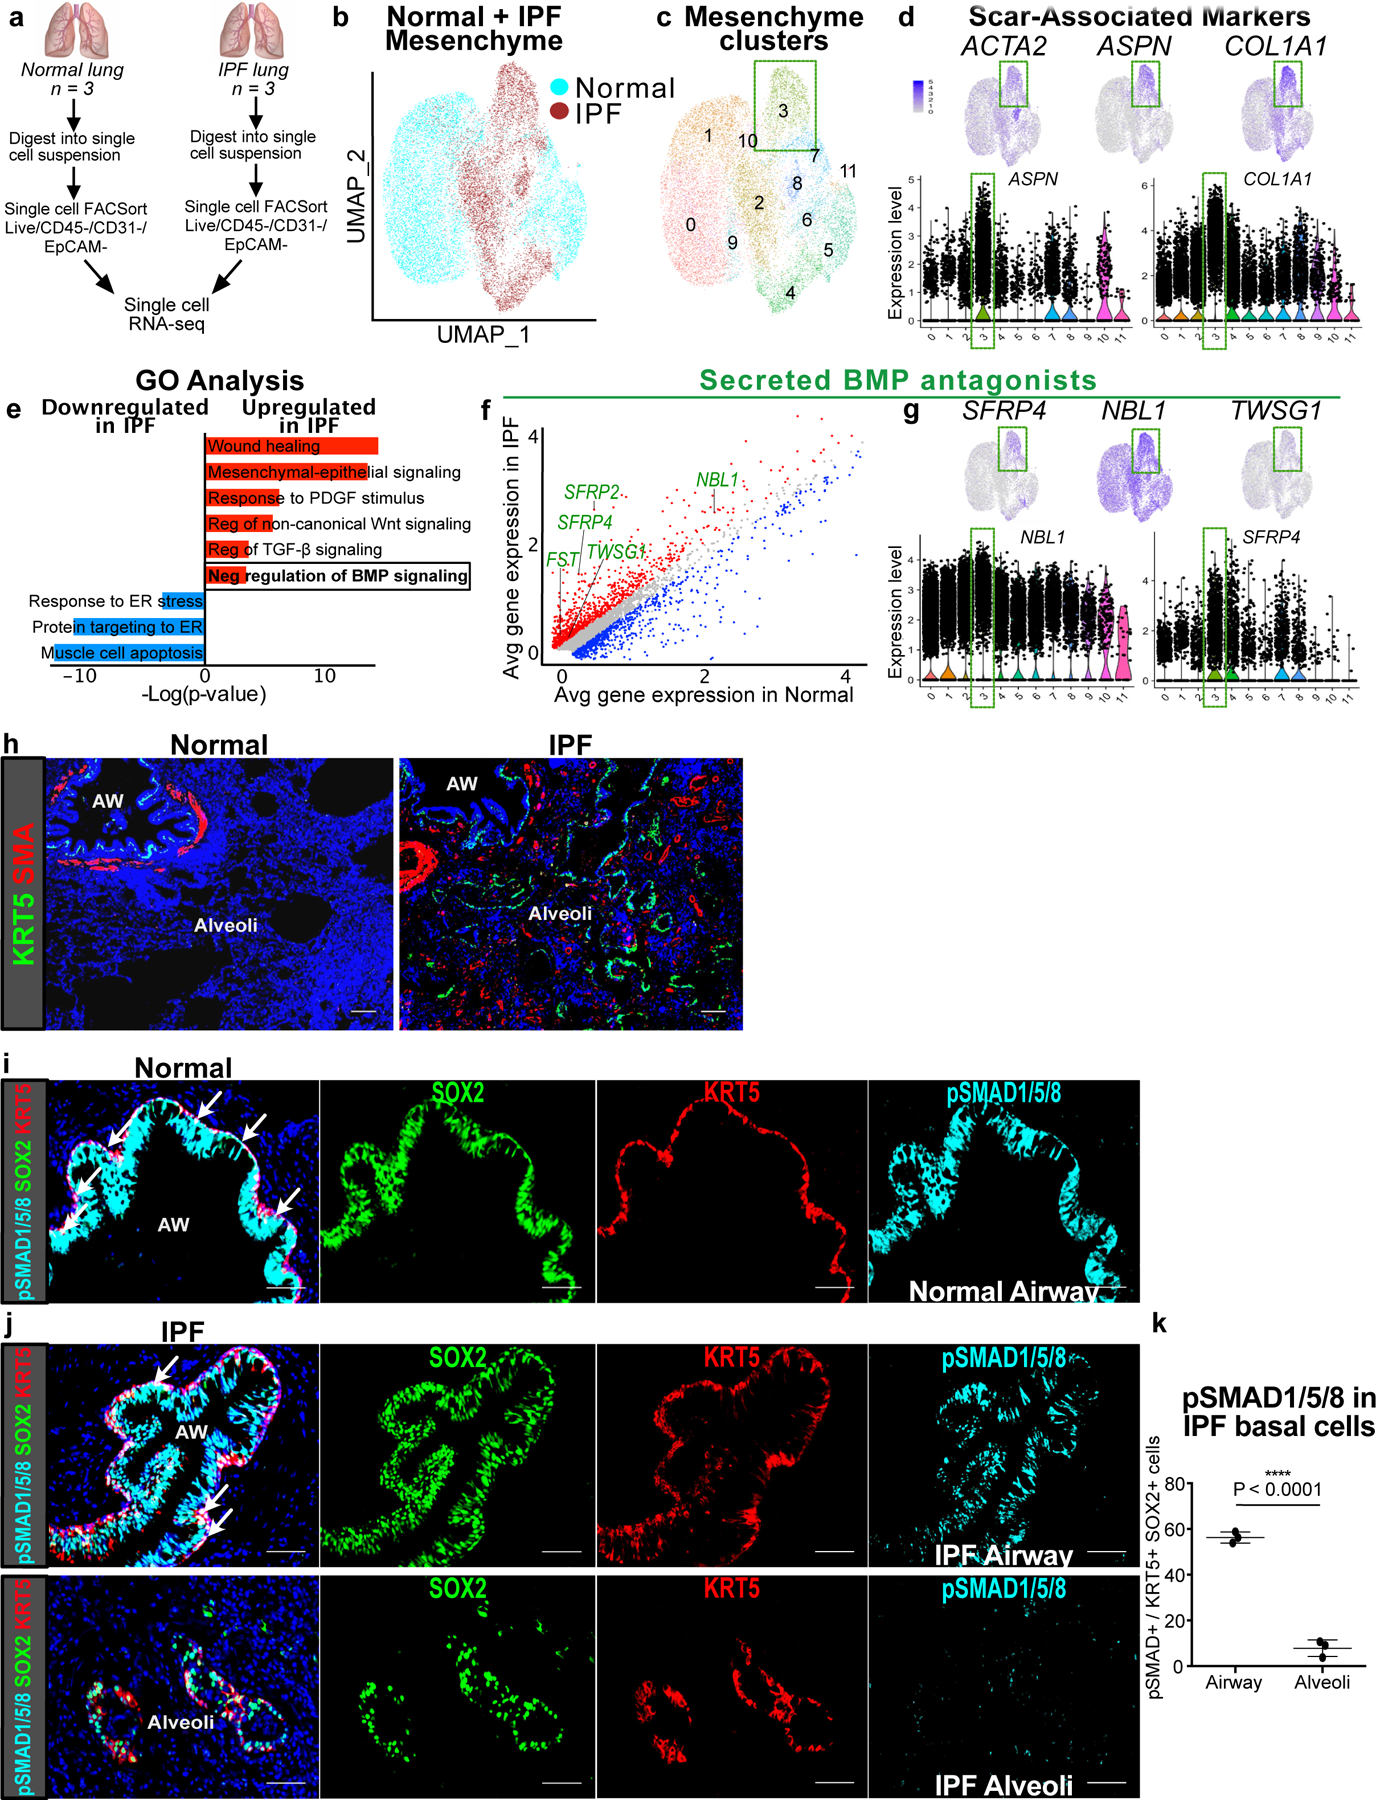
Figure 7. IPF lungs display altered BMP activation in the epithelium.

(a) Workflow to isolate mesenchymal cells from explanted IPF lungs and normal donor lungs for single cell RNA-seq analysis (n = 3 per group).
(b) UMAP plot with cells of origin based on disease state (IPF vs. normal) shows distinct cellular populations that emerge in the fibrotic state.
(c,d) UMAP, gene feature, and violin plots of cluster 3 and scar-associated genes such as myofibroblast differentiation markers, ACTA2 and ASPN, and scar matrix component, COL1A1. Each black dot represents one cell. The violin bodies represent distribution of the cells (n = 17,602 cells).
(e) GO term analysis of differentially-expressed genes between IPF and normal lung mesenchyme shows enrichment for genes involved in negative regulation of BMP signaling (P-adj = 2.04E-02; MAST test).
(f) Gene correlation plot with genes significantly upregulated in IPF in red (P-adj < 0.1, logfc >0.15; MAST test) and downregulated in blue (P-adj < 0.1, logfc <−0.15; MAST test). Secreted BMP antagonists (GO term: negative regulation of BMP signaling) are labeled in green.
(g) Expression of BMP antagonists in scar-associated cluster 3.
(h) Histology of normal and IPF lungs shows the metaplastic presence of KRT5+ pods and SMA+ fibroblastic foci in the alveoli in IPF. This experiment was repeated independently twice with similar results.
(i) pSMAD1/5/8 staining of normal distal airway shows uniform co-localization with SOX2 and KRT5 at the base of the pseudostratified epithelium. This experiment was repeated independently twice with similar results.
(j) Top: pSMAD1/5/8 staining of distal airway from IPF lung shows co-localization with SOX2. Bottom: pSMAD1/5/8 staining in the metaplastic SOX2+/KRT5+ basal cells in the alveoli. This experiment was repeated three times independently with similar results.
(k) pSMAD1/5/8 staining in the alveolar SOX2+/KRT5+ basal cells relative to their airway counterpart in IPF lungs (n = 3 samples; same sample was analyzed in the airway and alveolar region; one-tailed unpaired Student’s t-test). Data are expressed as mean ± SD.
Scale bars, 100 µm.
