
Extended Data Fig. 2. Lineage tracing of diverse airway progenitors after bleomycin injury.
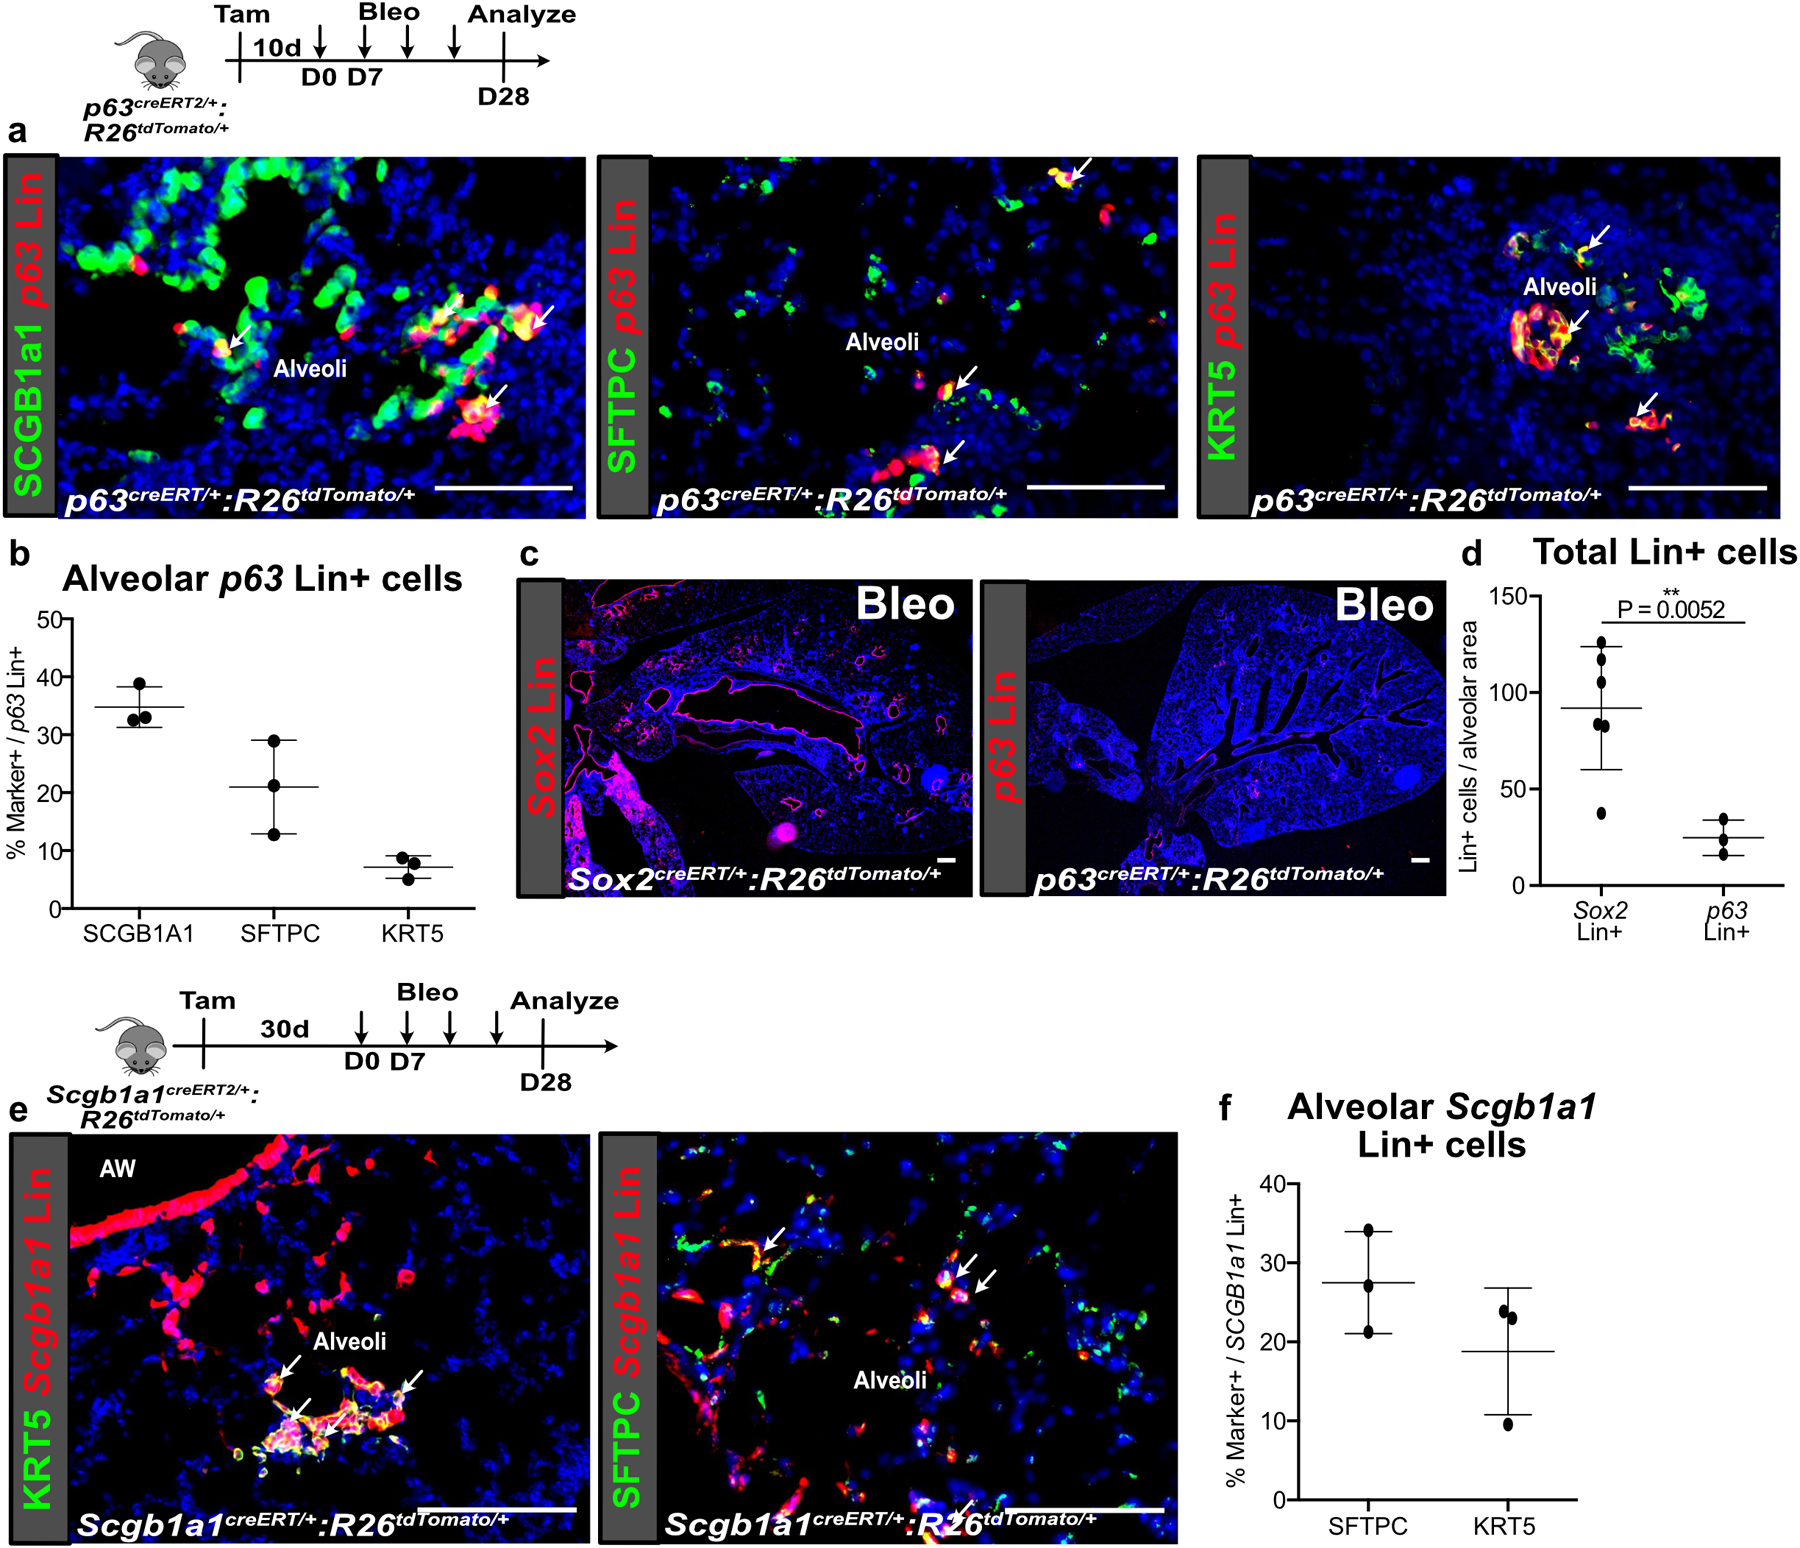
(a,b) p63 Lin+ cells also expanded into the alveoli after bleomycin but did not contribute significantly to KRT5+ basal cells in the alveoli. (n = 3 animals). Data are expressed as mean ± SD.
(c,d) Comparison of p63 Lin+ and Sox2 Lin+ cells that expand into the alveoli after bleomycin injury. (n = 3 for p63 Lin, n = 6 for Sox2 Lin; each data point represents one animal; one-tailed unpaired Student’s t-test). Data are expressed as mean ± SD.
(e,f) Contribution of Scgb1a1 Lin+ cells to the various epithelial lineages in the alveoli after bleomycin injury. (n = 3 per group; each data point represents one animal). Data are expressed as mean ± SD.
AW = airway. Scale bars, 100 µm.