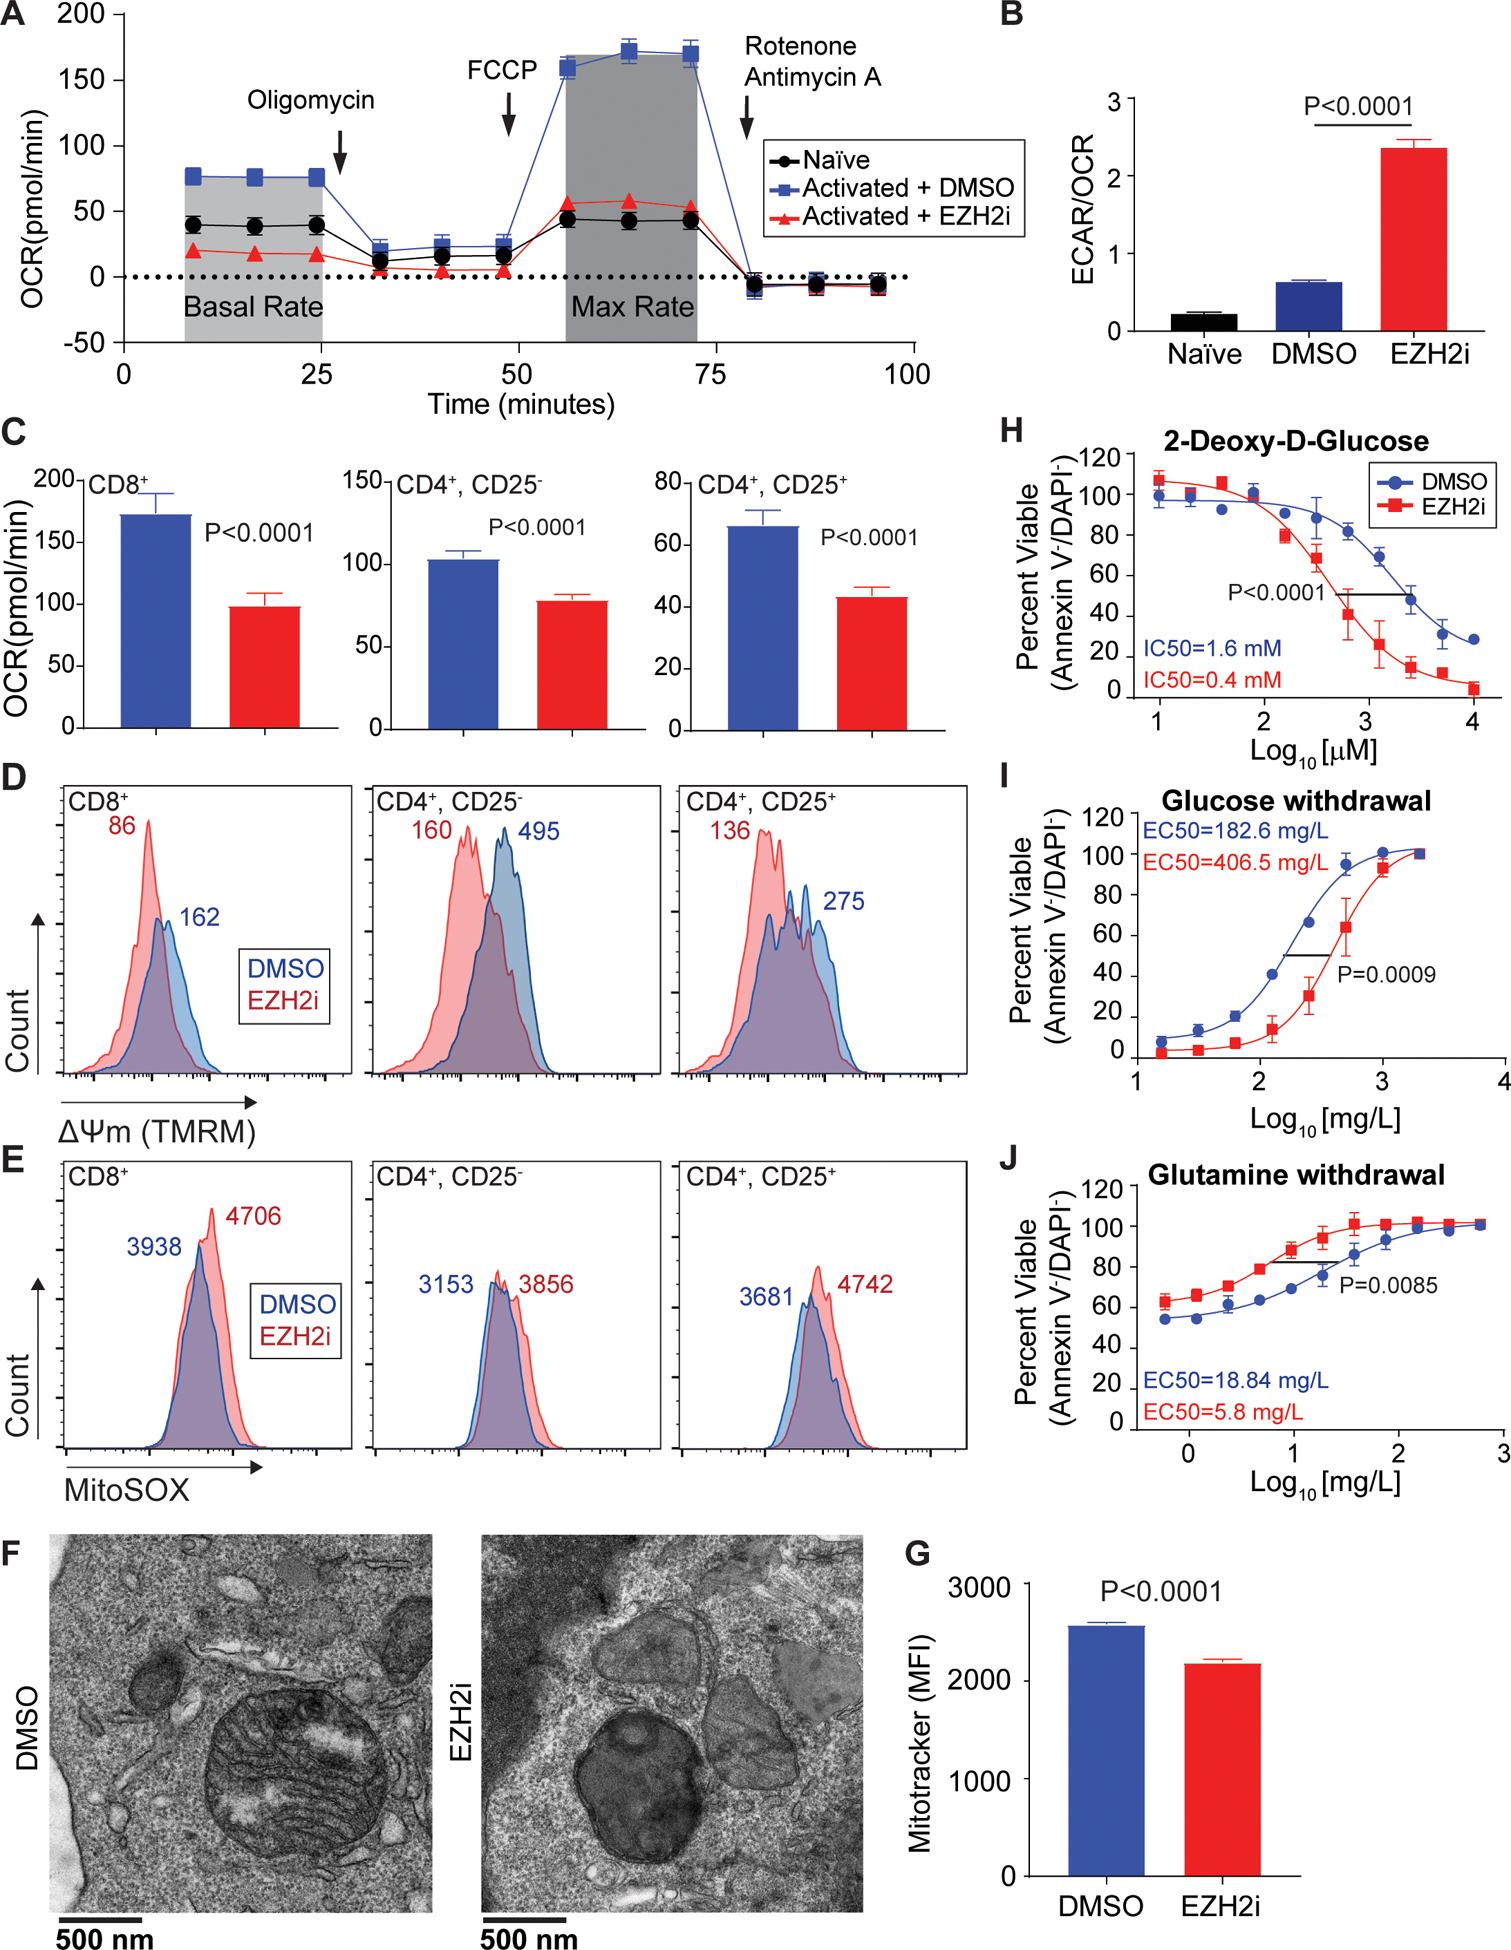
Figure 2: Loss of EZH2 leads to metabolic exhaustion in CD8+ T cells.

(A) Representative trace of oxygen consumption rate (OCR) in pre-activated CD8+ T cells treated for 48 hours with EZH2i. Arrows indicate injection time of respective inhibitors: Oligomycin (ATP synthase inhibitor), FCCP (Uncoupler), and Rotenone + Antimycin (Complex I & III). Naïve T cells were used for comparison. (B) Glycolytic dependency determined by the ratio of extracellular acidification rates (ECAR) and OCR. Data represent the mean and error bars represent the SEM. P value was determined by unpaired t test. (C-E) Parallel analysis of activated cytotoxic (CD8+), helper (CD4+CD25−), and regulatory (CD4+CD25+) T cells ±EZH2i: (C) OCR, (D) mitochondrial membrane potential (TMRM), and (E) mitochondrial superoxide species (MitoSOX). Histogram median fluorescent intensity (MFI) is indicated. (F) Representative transmission electron microscopy of activated CD8+ T cells ±EZH2i. (G) Relative mitochondrial mass FACS analysis (MitoTracker FM) from T cells ±EZH2i. Data represent the mean (n=3) and error bars represent the SEM. P value was determined by unpaired t test. (H-J) Viability was determined by Annexin-V/DAPI staining in CD8+ T cell cultures treated with: (H) increasing doses of 2-DG, (I) glucose withdrawal, and (J) glutamine withdrawal for 24 hours. Data represent the mean (n=3) and error bars represent SEM. Sum-of-squares F test used for statistical comparison of IC50s.
