
Figure 3: Loss of H3K27me3 leads to histone epigenetic reprogramming at the Cdkn2a locus.
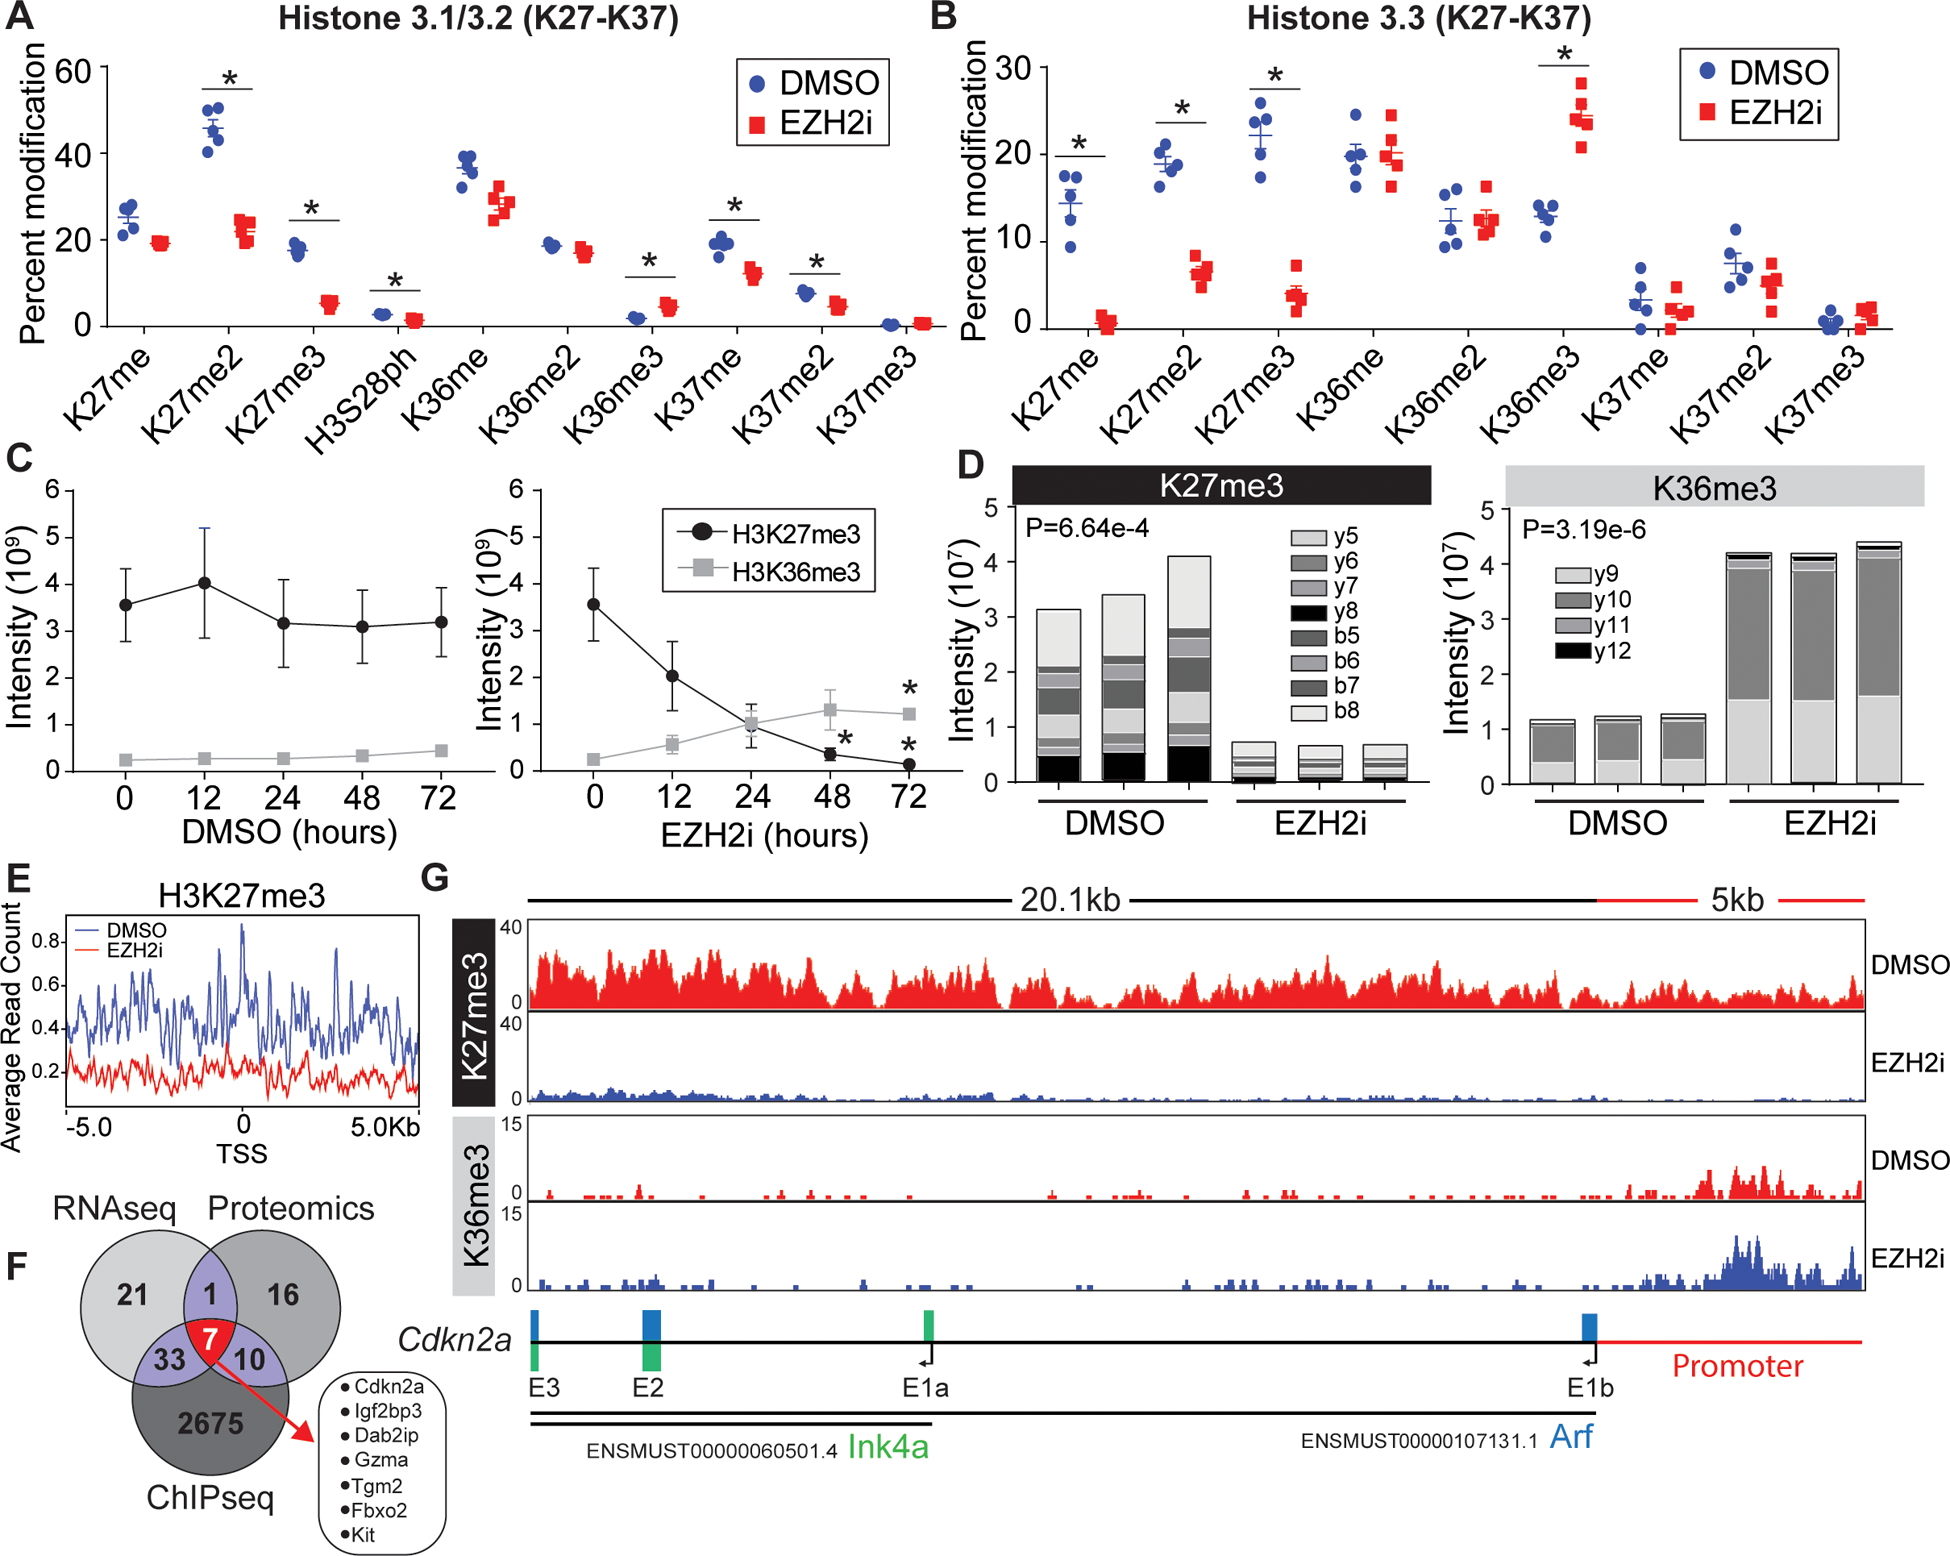
(A, B) Proteomic analysis of acid extracted histones from in vitro activated CD8+ T cells treated post activation with vehicle or EZH2i. Relative abundance of (A) histone H3.1/2 and (B) histone H3.3 post translational modifications are presented as a percent of total peptide spectral counts. Individual replicates (n=5) are plotted as a mean and errors bars represent SEM. Asterisks denote corrected P value <.05 (Holm-Sidak). (C) Proteomic quantification of H3K36me3 and H3K27me3 from time points post EZH2i treatment. Data represent the mean (n=3) and error bars represent SEM. Asterisks signify an adjusted P value <0.05 (2way-ANOVA) (D) Parallel reaction monitoring (PRM) mass spectrometry for H3K36me3 and H3K27me3 from activated T cells 48 hours post EZH2 inhibition. The Specific b and y ion series noted were used to distinguish K36 and K27 trimethylation. Representative data from 3 biological replicates. (E) Average read counts of H3K27me3 relative to the global TSS ±5kb (F) H3K27me3 ChIP-Seq of control and EZH2i treated T cells. 2725 loci with a log2FC<−2.5 were identified, a venn diagram was used to compare genes identified in RNAseq, proteomics, and ChIP-seq data sets. (G) IGV views of H3K27me3 and H3K36me3 read densities at the Cdkn2a locus. Bottom schematic shows the distribution of Arf and Ink4a exons.