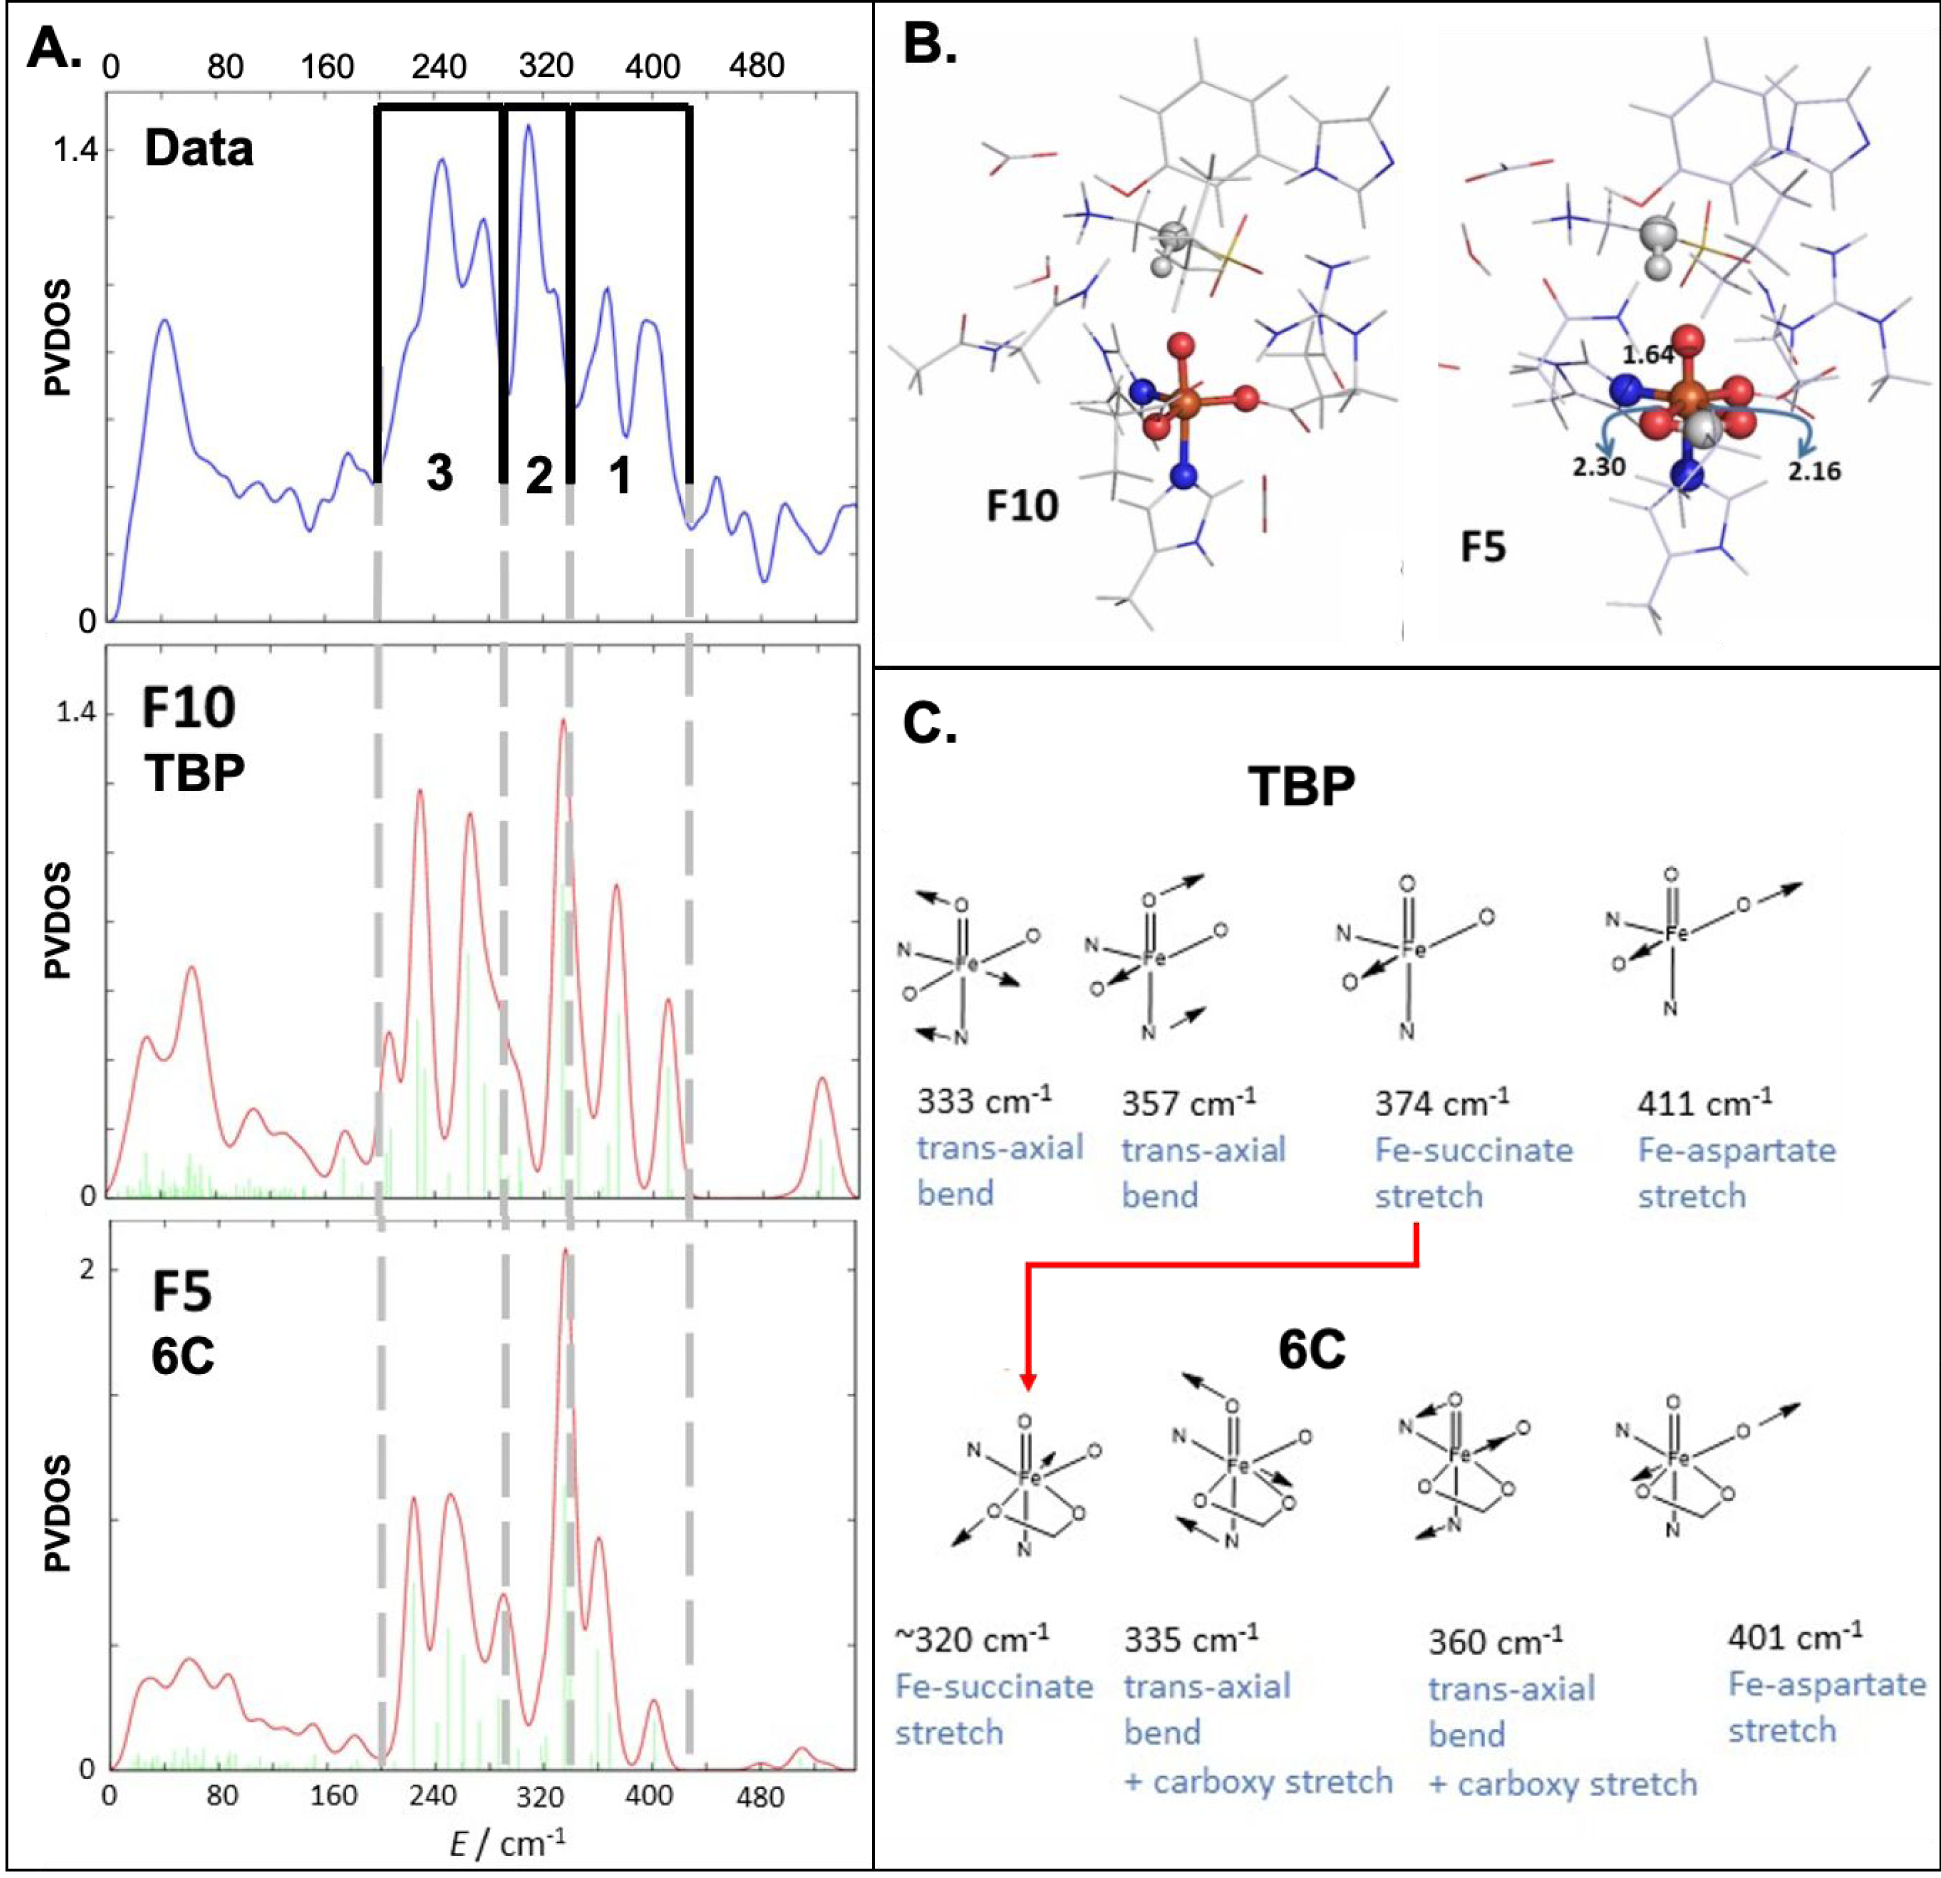
Figure 3.

(A) (Top) Experimental NRVS PVDOS spectrum of TauD-J. The spectrum is divided in three regions 3, 2 and 1 as indicated; Simulated NRVS spectra for (Middle) TBP (F10) and (Bottom) 6C (F5) geometries. (B) Structures of the TBP F10 and 6C F5 complexes highlighting the change in denticity of the succinate ligand; (C) The vibrational mode assignments in regions 1 and 2 for the TBP and 6C geometries. The red arrow shows the decrease in energy of the Fe-succinate stretch associated with the monodentate carboxylate in TBP going bidentate in 6C.
