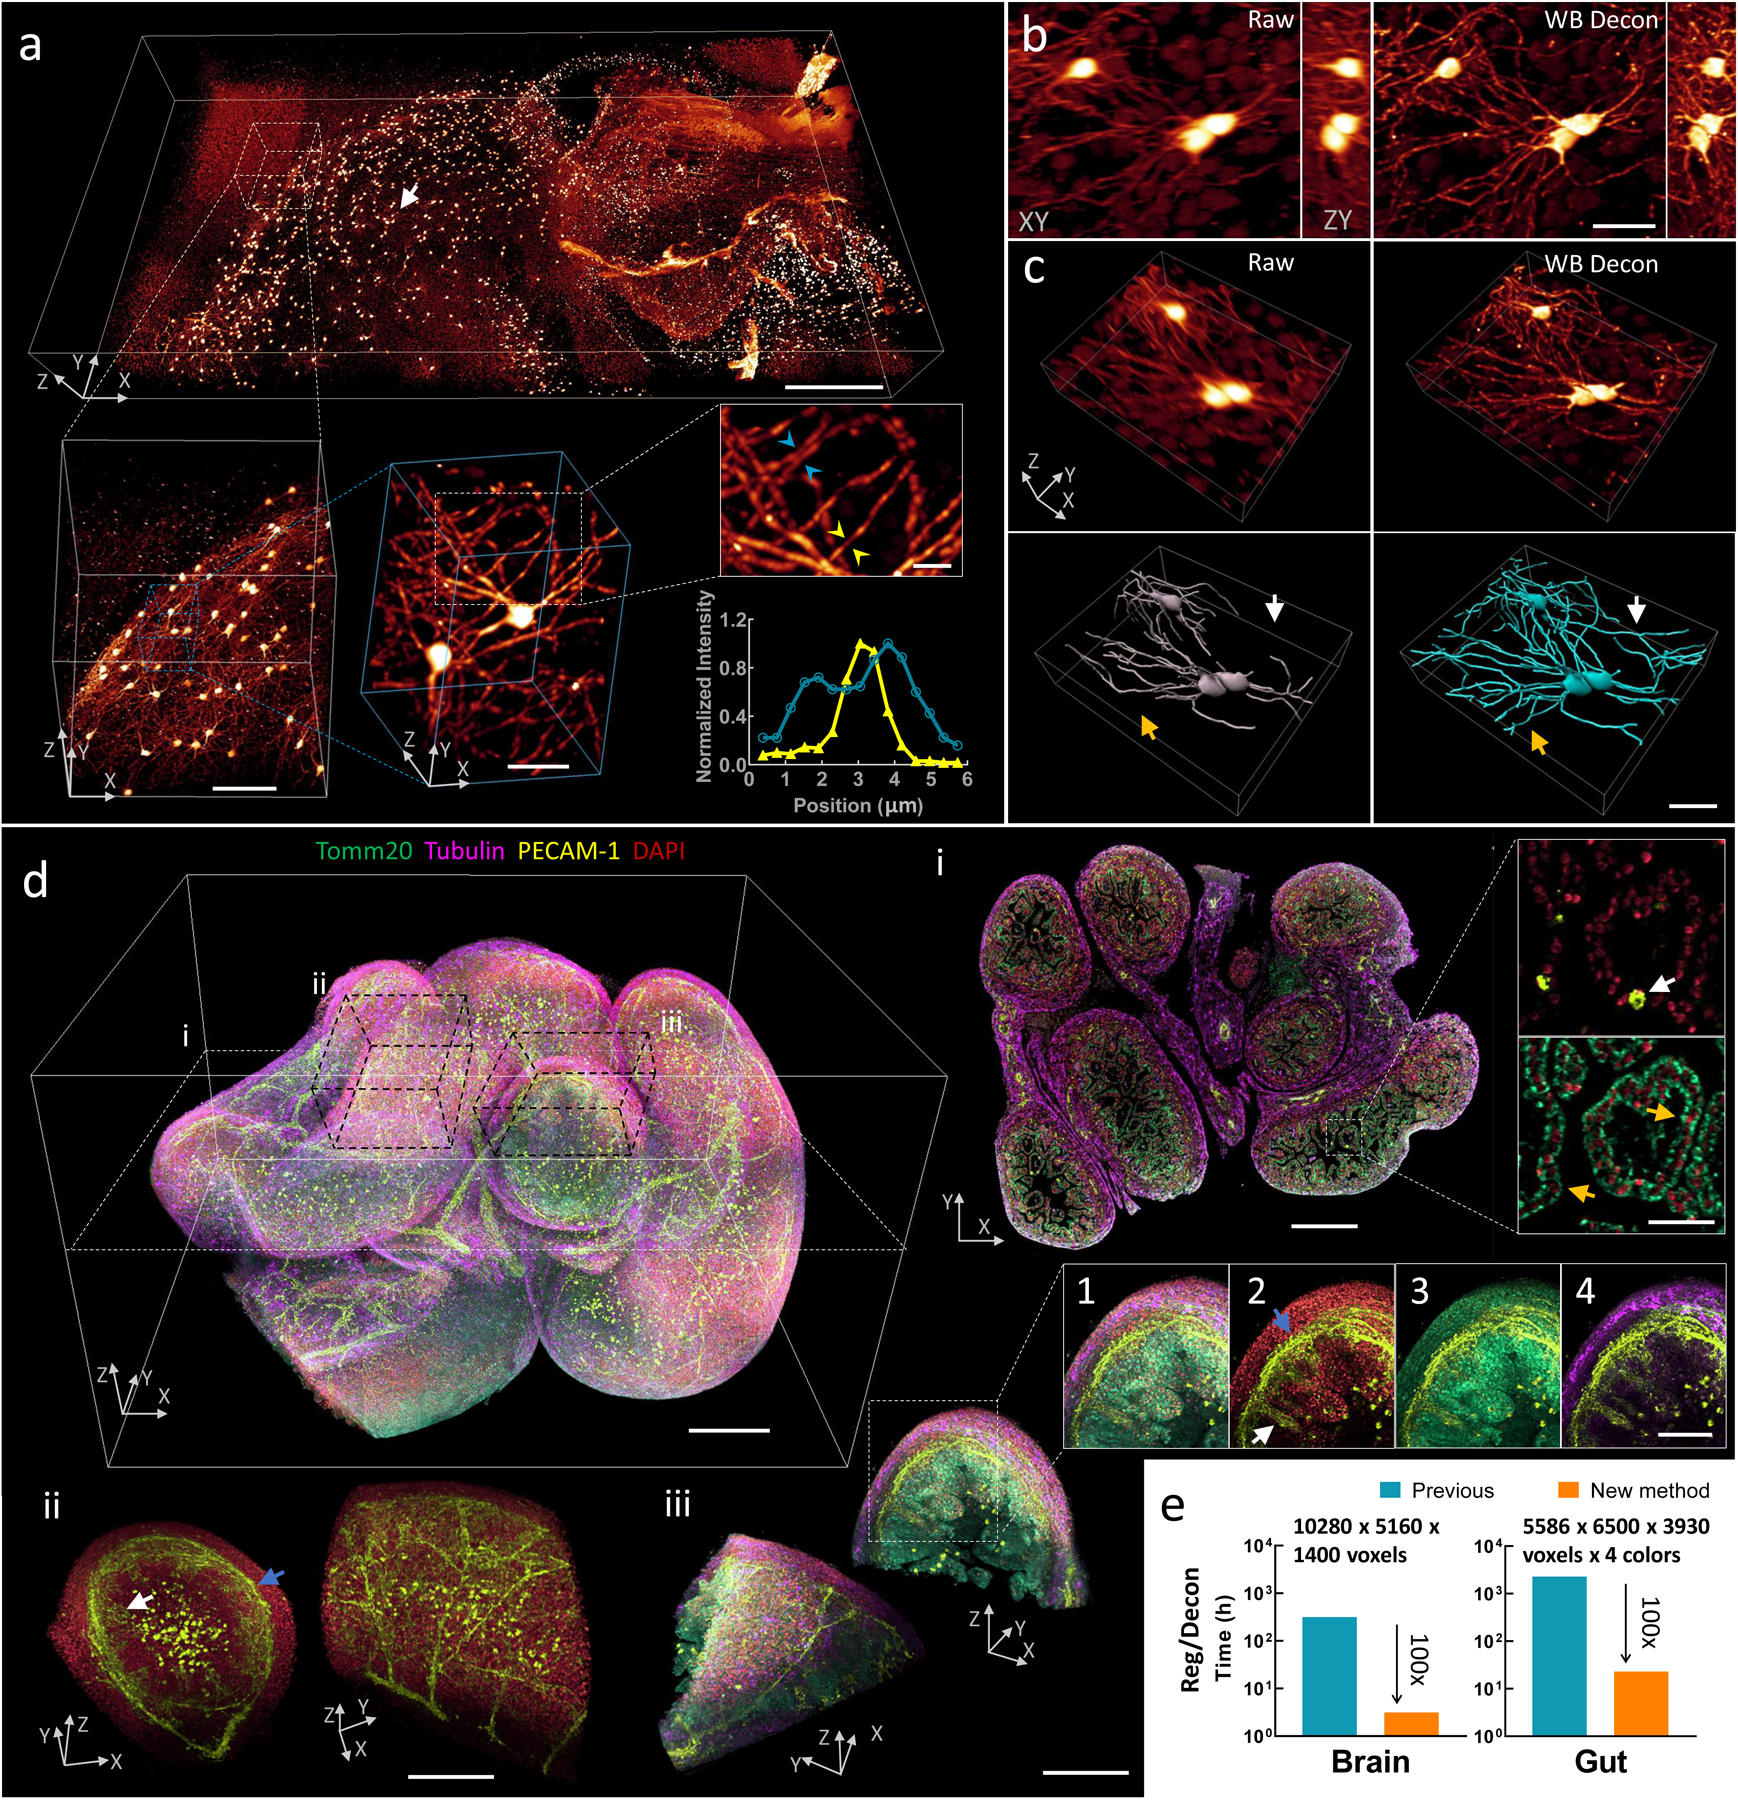
Fig. 3, Imaging mm-scale cleared tissue volumes with isotropic micron-scale spatial resolution.

a) 4 × 2 × 0.5 mm3 volume of brain from fixed and iDISCO+-cleared V1b mouse, immunolabeled with Alexa Fluor 555 secondary antibody against tdTomato primary antibody, imaged with cleared tissue diSPIM, and reconstructed after dual-view registration and Wiener-Butterworth (WB) deconvolution. Progressively higher resolution subvolumes are indicated, with line profiles indicating 1.3 μm neurite FWHM (yellow arrowheads) and 1.9 μm separation between neurites (blue arrowheads). See also Supplementary Video 11. b) Lateral/axial cross sections from region indicated with white arrow in a), emphasizing the higher resolution obtained with WB deconvolution compared to raw single-view data. c) Volume renderings of region displayed in b), again comparing raw data to deconvolution. Manually traced neurites are shown in bottom row; colored arrows indicate neurites traced in deconvolution that are obscured in raw single-view data. d) 2.1 × 2.5 × 1.5 mm3 intestinal volume from fixed and iDISCO-cleared E18.5 mouse; labeled with DAPI (red), Alexa-647 conjugated secondary antibody against Tomm20 primary antibody (green), Alexa-488 conjugated secondary antibody against PECAM-1 primary antibody (yellow), and Alexa-568 conjugated secondary antibody against α-Tubulin primary antibody (purple); imaged with cleared tissue diSPIM; and reconstructed after dual-view registration and WB deconvolution. See also Supplementary Video 12. i: Single plane demarcated by dotted white rectangular region at left, showing 4-color cross section and higher magnification dual-color views highlighting hollow blood vessel (white arrow) and mitochondria surrounding individual nuclei (orange arrows). ii: Subvolume demarcated by dotted black parallelepiped above, illustrating different perspectives of vascular plexus supplying submucosa (blue arrow) and mucosa (white arrow) of intestine. iii: Different perspectives of four-color subvolume demarcated by dotted black parallelepiped above and insets 1–4, highlighting hierarchical organization within intestine, e.g., submucosa (blue arrow) and mucosa (white arrow) (inset 2); mitochondrially-enriched regions that support the high energy demand and constant cellular renewal within the mucosa (inset 3); outer intestinal wall with dense alpha-tubulin staining (inset 4). See also Supplementary Fig. 19. e) Bar graphs showing the registration and deconvolution time required for post-processing datasets (image sizes in a) and d) as indicated), comparing previous (blue) and new (orange, 100-fold reduction in time) post-processing methods. Note that times for previous method are estimated (see Methods for further detail) and the log scale on the ordinate axes. Scale bars: a) 500 μm, 100 μm, 30 μm and 10 μm for progressively higher magnifications; b) and c) 30 μm; d) top left 300 μm, i: 300 μm and 30 μm for insets, ii: 200 μm, iii: 200 μm and 100 μm for insets. See also Supplementary Videos 13–15. Experiments were repeated on similar datasets at least 3 times, with similar results obtained each time; representative data from a single experiment are shown.
