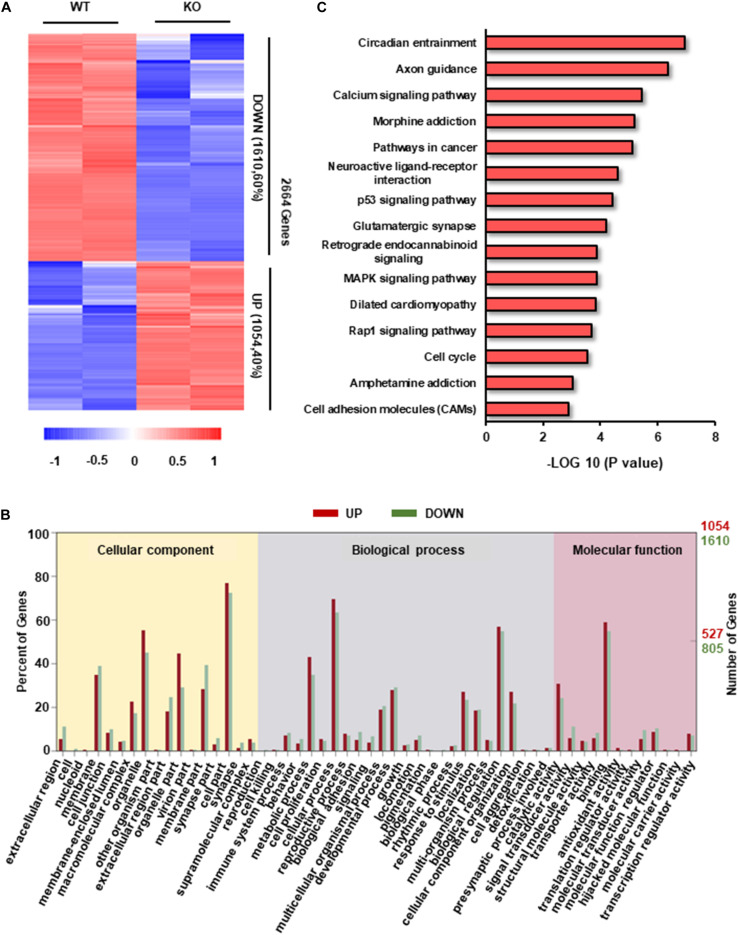
FIGURE 3.
Transcriptome analysis in RAD deficient and WT CMs. (A) Heatmap of transcripts from WT and KO CMs (n = 2, respectively) show consistency within groups. Red: upregulated transcripts. Blue: downregulated transcripts. (B) Gene ontology (GO) term categories and distribution of differentially expressed genes. GO terms are divided into three categories: cellular component, molecular function and biological process. (C) Significantly enriched Kyoto Encyclopedia Genes and Genomes (KEGG) pathways in KO CMs.

