FIGURE 4.
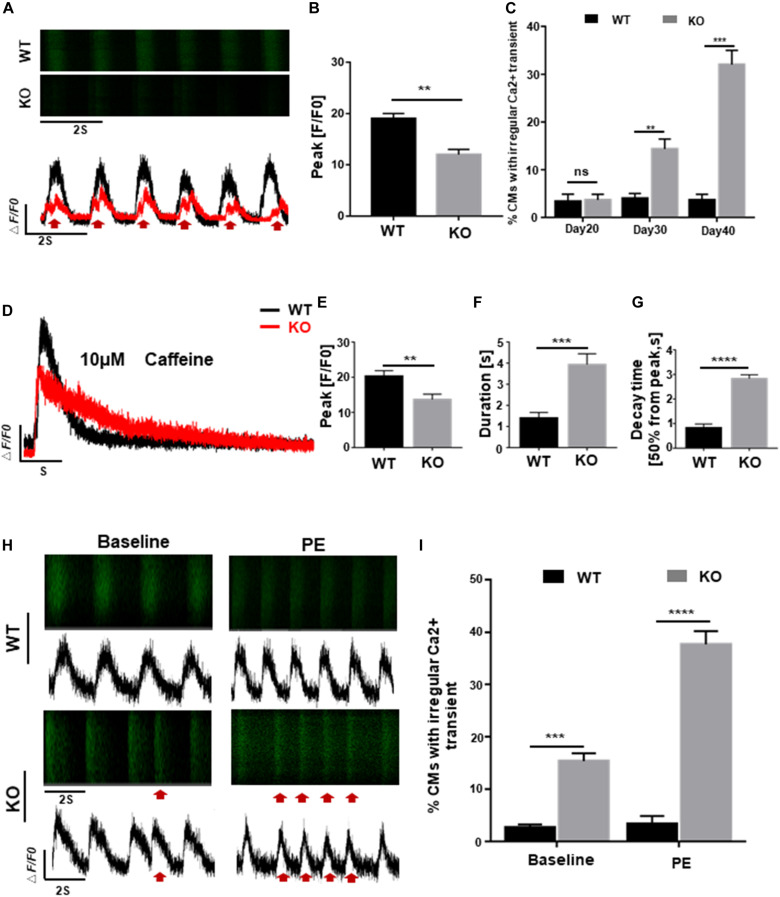
RAD deficient CMs display abnormal regulation of intracellular calcium. (A) Representative line-scan images in WT and KO CMs. Red arrows indicate arrhythmia-like voltage waveforms observed in KO CMs but not in WT. (B) Peak amplitudes in WT and KO CMs (n = 30 cells per group). (C) Quantification of percentages for WT and KO CMs exhibit abnormal calcium regulation at days 20, 30, and 40 (n = 30 cells per group). (D) Representative Ca2 + transient from WT and KO CMs induced by caffeine exposure (n = 5 cells per group). (E–G) Peak amplitudes, duration and decay time after caffeine-induced Ca2 + transient in WT and KO CMs. (H) Representative line-scan images in WT and KO CMs after adrenergic stimuli by PE. Red arrows indicate arrhythmia-like voltage waveforms. (I) Quantification of WT and KO CMs exhibit arrhythmia-like voltage waveforms in response to PE. Data are expressed as means ± S.E.M. of three independent experiments. ns, not significant; **P < 0.01; ***P < 0.001; ****P < 0.0001.

