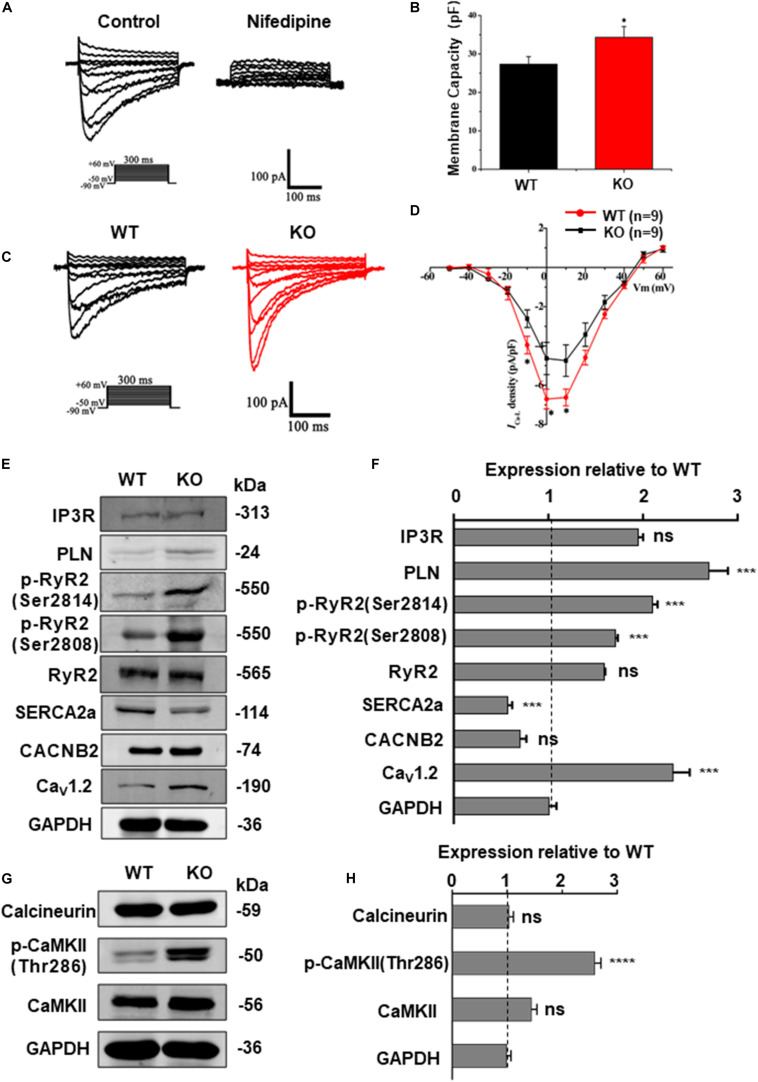
FIGURE 6.
RAD deficient CMs show increased ICa–L and CaMKII activity. (A) Recording and identification of representative ICa–L from a series of step pulses between −50 mV to +60 mV from a holding potential of −80 mV. 200 nM nifedipine, a specific blocker of L-type voltage-gated Ca2 + channels, blocked the current. (B) Histogram analysis showing that the cell membance capacity (pF) was larger in KO CMs than that in WT CMs. (C) Typical ICa–L recording from WT CMs (black traces) and KO CMs (red traces). (D) I-V curves ICa–L showing that ICa–L density was significantly increased in KO CMs (n = 9, respectively). (E) Western blot shows expression of protein related to calcium regulation in WT and KO CMs, respectively. (F) Quantification of protein expression normalized by GAPDH in WT and KO CMs. (G) Western blot shows expression of calcineurin A, CaMKIIδ and phosphorylated CaMKII (Thr286) in WT and KO CMs, respectively. (H) Quantification of protein expression normalized by GAPDH in WT and KO CMs. Data are expressed as means ± S.E.M. of three independent experiments. ns, not significant; *P < 0.05; ***P < 0.001; ****P < 0.0001.

