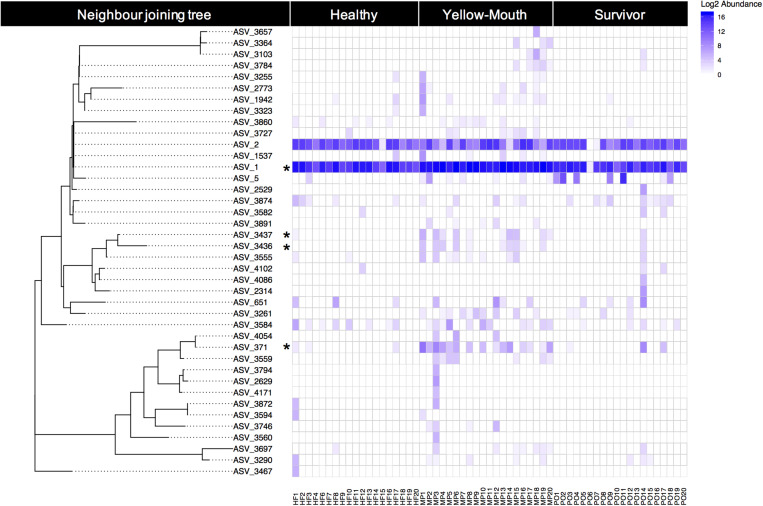
FIGURE 5.
Relative (log2) abundance of ASVs that were classified as T. maritimum for individual fish within different disease states. The genetic relationship between ASVs was explored using a neighbor joining tree analysis and is shown on the left. Asterisk denotes those ASVs that were deemed significantly more abundant in the YM samples compared to healthy fish.

