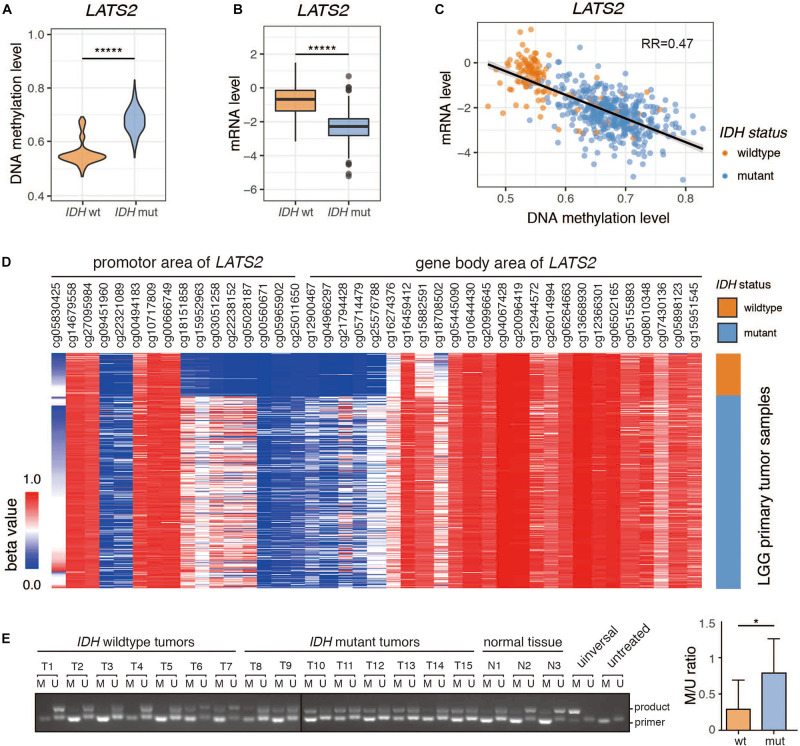
FIGURE 1.
Promoter hypermethylation and low expression of LATS2 in IDH-mutant LGG. (A) LATS2 methylation level is increased in IDH-mutant LGG. (B) LATS2 mRNA level is decreased in IDH-mutant LGG. (C) Correlation between LATS2 methylation level and LATS2 mRNA level. RR indicates R squared value of linear regression. (D) Methylation level of different CpG islands in LATS2 promoter and gene body area. (E) Methylation-specific PCR of LGG samples. M: methylation-specific primer; U: unmethylation-specific primers; universal: universally methylated genomic DNA control; untreated: untreated U87 cell genomic DNA; product: ∼130 bp PCR products; primer: primer dimers. Quantitative result on the right. M/U ratio was calculated by comparing the bands from methylation-specific and unmethylation-specific primers of each sample. Mean and standard error were presented (*p < 0.05, *****p < 0.000005, t test).

