FIGURE 4.
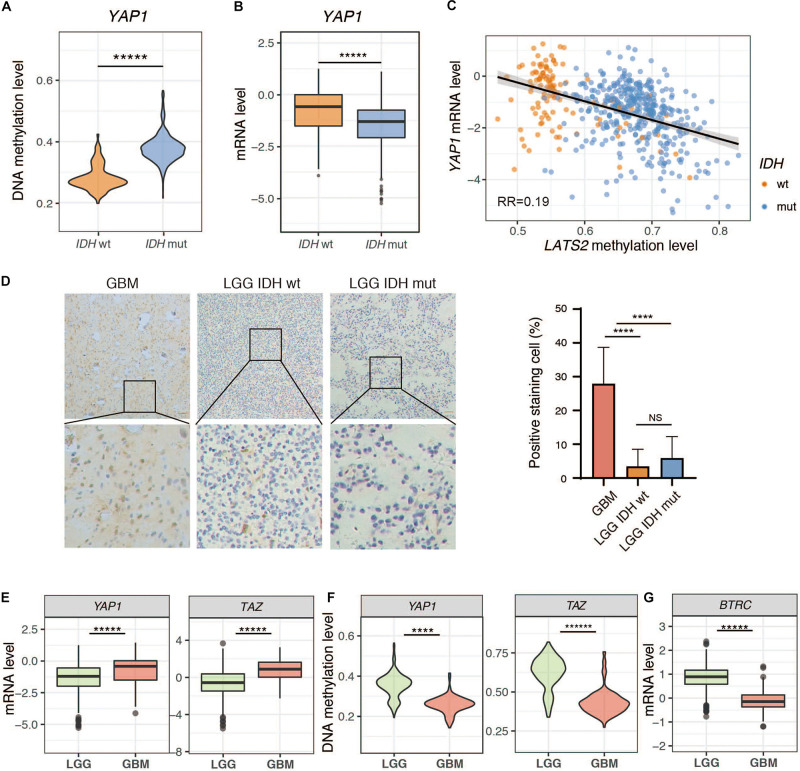
Low expression of YAP in LGG. (A) YAP methylation is elevated in IDH-mutant LGG. (B) YAP mRNA level is reduced in IDH-mutant LGG. (C) Correlation between YAP mRNA level and LATS2 methylation level. (D) IHC result of IDH-wildtype or mutant LGG samples and GBM samples. Left: Representative image; Right: Quantitative result. (E) YAP and TAZ mRNA levels in LGG and GBM. (F) YAP and TAZ methylation levels in LGG and GBM. (G) BTRC mRNA level in LGG and GBM. Mean and standard error were presented (****p < 0.00005, *****p < 0.000005, t test).

